Immigrants from Dominican Republic vs Osage 10th Grade
COMPARE
Immigrants from Dominican Republic
Osage
10th Grade
10th Grade Comparison
Immigrants from Dominican Republic
Osage
88.7%
10TH GRADE
0.0/ 100
METRIC RATING
335th/ 347
METRIC RANK
94.2%
10TH GRADE
91.7/ 100
METRIC RATING
134th/ 347
METRIC RANK
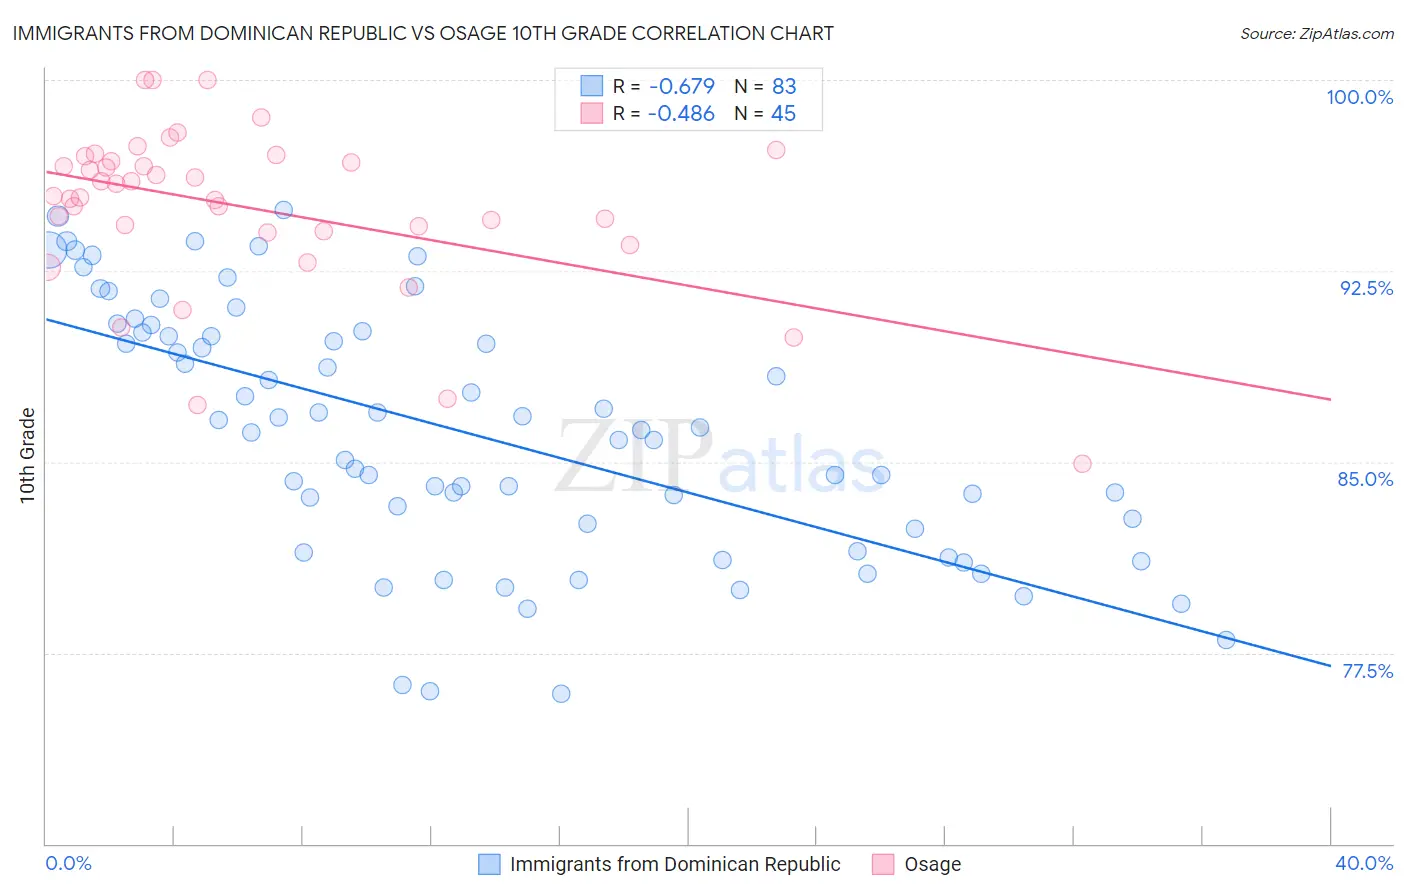
Immigrants from Dominican Republic vs Osage 10th Grade Correlation Chart
The statistical analysis conducted on geographies consisting of 275,144,349 people shows a significant negative correlation between the proportion of Immigrants from Dominican Republic and percentage of population with at least 10th grade education in the United States with a correlation coefficient (R) of -0.679 and weighted average of 88.7%. Similarly, the statistical analysis conducted on geographies consisting of 91,808,929 people shows a moderate negative correlation between the proportion of Osage and percentage of population with at least 10th grade education in the United States with a correlation coefficient (R) of -0.486 and weighted average of 94.2%, a difference of 6.2%.
10th Grade Correlation Summary
| Measurement | Immigrants from Dominican Republic | Osage |
| Minimum | 75.9% | 84.9% |
| Maximum | 94.9% | 100.0% |
| Range | 19.0% | 15.1% |
| Mean | 86.1% | 95.0% |
| Median | 86.3% | 95.4% |
| Interquartile 25% (IQ1) | 82.4% | 94.0% |
| Interquartile 75% (IQ3) | 90.1% | 96.9% |
| Interquartile Range (IQR) | 7.7% | 2.9% |
| Standard Deviation (Sample) | 4.9% | 3.2% |
| Standard Deviation (Population) | 4.8% | 3.2% |
Similar Demographics by 10th Grade
Demographics Similar to Immigrants from Dominican Republic by 10th Grade
In terms of 10th grade, the demographic groups most similar to Immigrants from Dominican Republic are Hispanic or Latino (88.9%, a difference of 0.18%), Immigrants from Honduras (88.5%, a difference of 0.19%), Honduran (89.0%, a difference of 0.30%), Immigrants from the Azores (89.0%, a difference of 0.33%), and Central American (88.4%, a difference of 0.35%).
| Demographics | Rating | Rank | 10th Grade |
| Immigrants | Cabo Verde | 0.0 /100 | #328 | Tragic 89.5% |
| Dominicans | 0.0 /100 | #329 | Tragic 89.4% |
| Immigrants | Yemen | 0.0 /100 | #330 | Tragic 89.1% |
| Mexican American Indians | 0.0 /100 | #331 | Tragic 89.0% |
| Immigrants | Azores | 0.0 /100 | #332 | Tragic 89.0% |
| Hondurans | 0.0 /100 | #333 | Tragic 89.0% |
| Hispanics or Latinos | 0.0 /100 | #334 | Tragic 88.9% |
| Immigrants | Dominican Republic | 0.0 /100 | #335 | Tragic 88.7% |
| Immigrants | Honduras | 0.0 /100 | #336 | Tragic 88.5% |
| Central Americans | 0.0 /100 | #337 | Tragic 88.4% |
| Immigrants | Latin America | 0.0 /100 | #338 | Tragic 88.3% |
| Guatemalans | 0.0 /100 | #339 | Tragic 87.9% |
| Mexicans | 0.0 /100 | #340 | Tragic 87.8% |
| Salvadorans | 0.0 /100 | #341 | Tragic 87.5% |
| Immigrants | Guatemala | 0.0 /100 | #342 | Tragic 87.4% |
Demographics Similar to Osage by 10th Grade
In terms of 10th grade, the demographic groups most similar to Osage are Creek (94.2%, a difference of 0.010%), Immigrants from Korea (94.2%, a difference of 0.010%), Immigrants from Russia (94.3%, a difference of 0.020%), Iroquois (94.3%, a difference of 0.030%), and Immigrants from Greece (94.3%, a difference of 0.030%).
| Demographics | Rating | Rank | 10th Grade |
| Israelis | 93.8 /100 | #127 | Exceptional 94.3% |
| Potawatomi | 93.6 /100 | #128 | Exceptional 94.3% |
| Iroquois | 92.8 /100 | #129 | Exceptional 94.3% |
| Immigrants | Greece | 92.7 /100 | #130 | Exceptional 94.3% |
| Immigrants | Eastern Europe | 92.5 /100 | #131 | Exceptional 94.3% |
| Immigrants | Russia | 92.4 /100 | #132 | Exceptional 94.3% |
| Creek | 91.9 /100 | #133 | Exceptional 94.2% |
| Osage | 91.7 /100 | #134 | Exceptional 94.2% |
| Immigrants | Korea | 91.3 /100 | #135 | Exceptional 94.2% |
| Shoshone | 90.8 /100 | #136 | Exceptional 94.2% |
| Arapaho | 90.5 /100 | #137 | Exceptional 94.2% |
| Immigrants | Sri Lanka | 89.9 /100 | #138 | Excellent 94.2% |
| Immigrants | Bosnia and Herzegovina | 89.4 /100 | #139 | Excellent 94.2% |
| Immigrants | Jordan | 87.6 /100 | #140 | Excellent 94.1% |
| Hmong | 86.6 /100 | #141 | Excellent 94.1% |