Immigrants from Venezuela vs Immigrants from Korea 6th Grade
COMPARE
Immigrants from Venezuela
Immigrants from Korea
6th Grade
6th Grade Comparison
Immigrants from Venezuela
Immigrants from Korea
97.0%
6TH GRADE
34.5/ 100
METRIC RATING
183rd/ 347
METRIC RANK
97.1%
6TH GRADE
57.7/ 100
METRIC RATING
164th/ 347
METRIC RANK
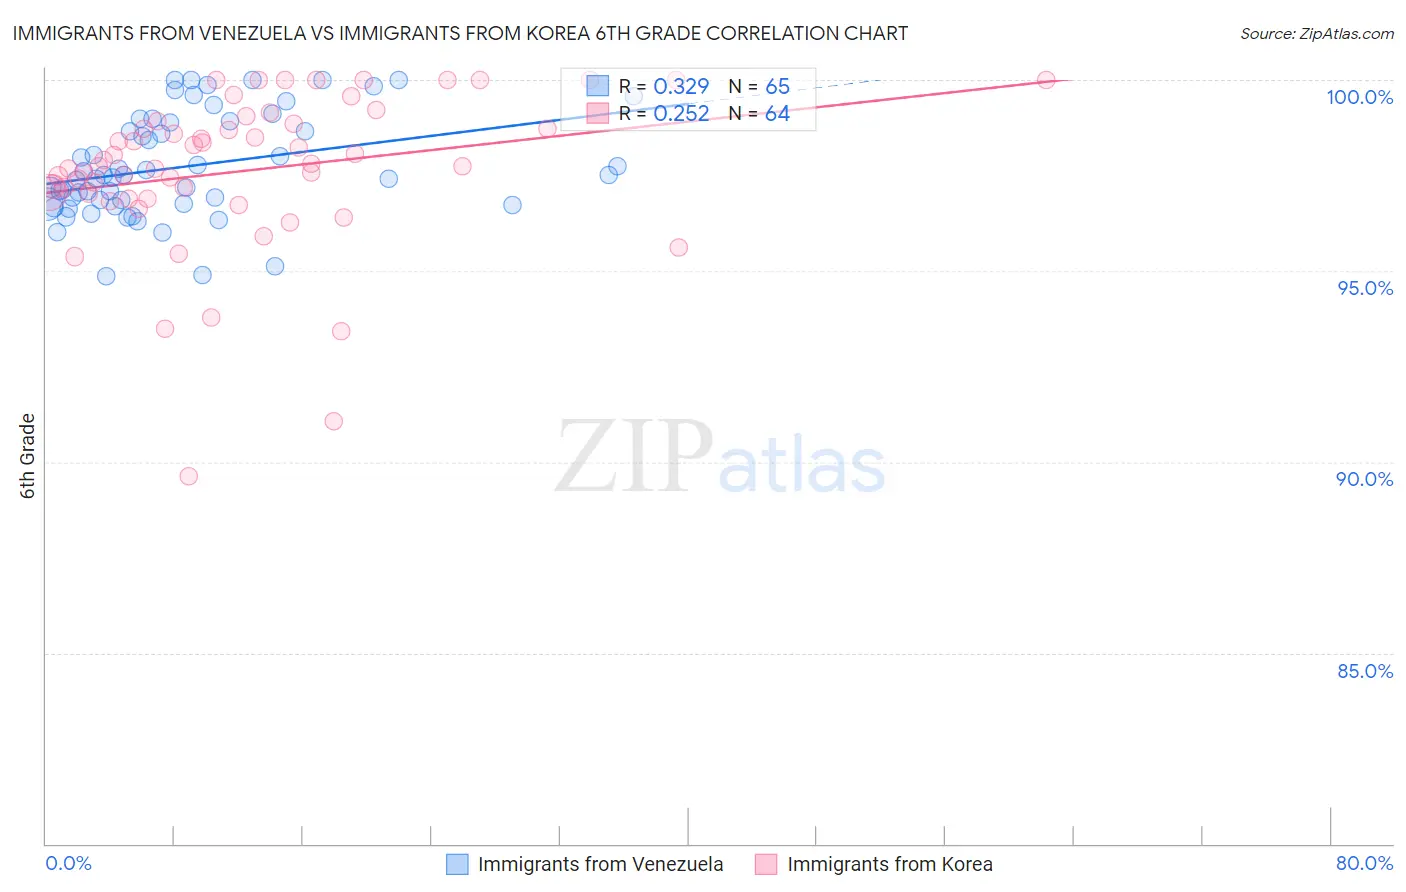
Immigrants from Venezuela vs Immigrants from Korea 6th Grade Correlation Chart
The statistical analysis conducted on geographies consisting of 287,866,009 people shows a mild positive correlation between the proportion of Immigrants from Venezuela and percentage of population with at least 6th grade education in the United States with a correlation coefficient (R) of 0.329 and weighted average of 97.0%. Similarly, the statistical analysis conducted on geographies consisting of 416,280,076 people shows a weak positive correlation between the proportion of Immigrants from Korea and percentage of population with at least 6th grade education in the United States with a correlation coefficient (R) of 0.252 and weighted average of 97.1%, a difference of 0.11%.
6th Grade Correlation Summary
| Measurement | Immigrants from Venezuela | Immigrants from Korea |
| Minimum | 94.9% | 89.6% |
| Maximum | 100.0% | 100.0% |
| Range | 5.1% | 10.4% |
| Mean | 97.7% | 97.6% |
| Median | 97.5% | 97.8% |
| Interquartile 25% (IQ1) | 96.8% | 97.0% |
| Interquartile 75% (IQ3) | 98.9% | 98.9% |
| Interquartile Range (IQR) | 2.1% | 1.9% |
| Standard Deviation (Sample) | 1.3% | 2.1% |
| Standard Deviation (Population) | 1.3% | 2.0% |
Demographics Similar to Immigrants from Venezuela and Immigrants from Korea by 6th Grade
In terms of 6th grade, the demographic groups most similar to Immigrants from Venezuela are Immigrants from Ukraine (97.0%, a difference of 0.010%), Comanche (97.0%, a difference of 0.020%), Immigrants from Spain (97.0%, a difference of 0.030%), Pakistani (97.0%, a difference of 0.050%), and Immigrants from Kenya (97.0%, a difference of 0.050%). Similarly, the demographic groups most similar to Immigrants from Korea are Albanian (97.1%, a difference of 0.0%), Immigrants from Poland (97.1%, a difference of 0.010%), Immigrants from Italy (97.1%, a difference of 0.020%), Apache (97.1%, a difference of 0.020%), and Immigrants from Taiwan (97.1%, a difference of 0.020%).
| Demographics | Rating | Rank | 6th Grade |
| Albanians | 57.8 /100 | #163 | Average 97.1% |
| Immigrants | Korea | 57.7 /100 | #164 | Average 97.1% |
| Immigrants | Poland | 56.2 /100 | #165 | Average 97.1% |
| Immigrants | Italy | 53.8 /100 | #166 | Average 97.1% |
| Apache | 53.6 /100 | #167 | Average 97.1% |
| Immigrants | Taiwan | 53.5 /100 | #168 | Average 97.1% |
| Bermudans | 52.6 /100 | #169 | Average 97.1% |
| Chileans | 52.1 /100 | #170 | Average 97.1% |
| Immigrants | Sri Lanka | 51.7 /100 | #171 | Average 97.1% |
| Egyptians | 50.9 /100 | #172 | Average 97.1% |
| Arabs | 50.1 /100 | #173 | Average 97.0% |
| Venezuelans | 50.0 /100 | #174 | Average 97.0% |
| Immigrants | Kazakhstan | 47.3 /100 | #175 | Average 97.0% |
| Immigrants | Micronesia | 47.1 /100 | #176 | Average 97.0% |
| Mongolians | 46.7 /100 | #177 | Average 97.0% |
| Pakistanis | 46.0 /100 | #178 | Average 97.0% |
| Immigrants | Kenya | 45.3 /100 | #179 | Average 97.0% |
| Immigrants | Spain | 39.9 /100 | #180 | Fair 97.0% |
| Comanche | 37.9 /100 | #181 | Fair 97.0% |
| Immigrants | Ukraine | 35.6 /100 | #182 | Fair 97.0% |
| Immigrants | Venezuela | 34.5 /100 | #183 | Fair 97.0% |