Japanese vs Immigrants from Norway 1st Grade
COMPARE
Japanese
Immigrants from Norway
1st Grade
1st Grade Comparison
Japanese
Immigrants from Norway
96.6%
1ST GRADE
0.0/ 100
METRIC RATING
329th/ 347
METRIC RANK
98.2%
1ST GRADE
96.6/ 100
METRIC RATING
112th/ 347
METRIC RANK
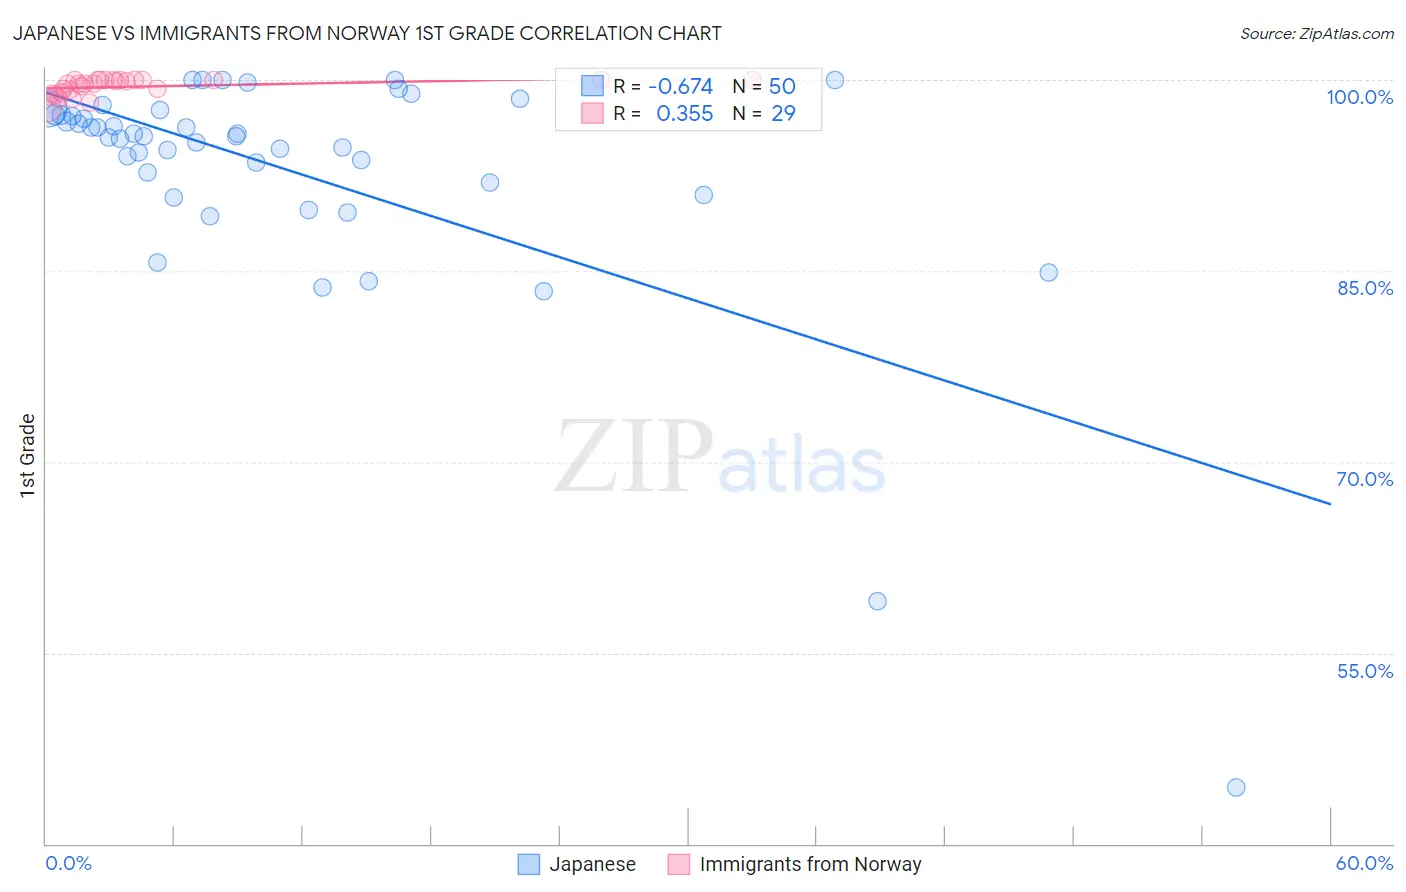
Japanese vs Immigrants from Norway 1st Grade Correlation Chart
The statistical analysis conducted on geographies consisting of 249,183,224 people shows a significant negative correlation between the proportion of Japanese and percentage of population with at least 1st grade education in the United States with a correlation coefficient (R) of -0.674 and weighted average of 96.6%. Similarly, the statistical analysis conducted on geographies consisting of 116,716,420 people shows a mild positive correlation between the proportion of Immigrants from Norway and percentage of population with at least 1st grade education in the United States with a correlation coefficient (R) of 0.355 and weighted average of 98.2%, a difference of 1.6%.
1st Grade Correlation Summary
| Measurement | Japanese | Immigrants from Norway |
| Minimum | 44.4% | 97.8% |
| Maximum | 100.0% | 100.0% |
| Range | 55.6% | 2.2% |
| Mean | 92.9% | 99.5% |
| Median | 95.6% | 99.7% |
| Interquartile 25% (IQ1) | 92.0% | 99.0% |
| Interquartile 75% (IQ3) | 97.3% | 100.0% |
| Interquartile Range (IQR) | 5.3% | 1.0% |
| Standard Deviation (Sample) | 9.7% | 0.64% |
| Standard Deviation (Population) | 9.6% | 0.63% |
Similar Demographics by 1st Grade
Demographics Similar to Japanese by 1st Grade
In terms of 1st grade, the demographic groups most similar to Japanese are Immigrants from Vietnam (96.6%, a difference of 0.010%), Immigrants from Armenia (96.6%, a difference of 0.030%), Immigrants from Latin America (96.7%, a difference of 0.040%), Mexican (96.7%, a difference of 0.050%), and Central American (96.5%, a difference of 0.070%).
| Demographics | Rating | Rank | 1st Grade |
| Mexican American Indians | 0.0 /100 | #322 | Tragic 96.8% |
| Immigrants | Honduras | 0.0 /100 | #323 | Tragic 96.8% |
| Vietnamese | 0.0 /100 | #324 | Tragic 96.8% |
| Dominicans | 0.0 /100 | #325 | Tragic 96.7% |
| Indonesians | 0.0 /100 | #326 | Tragic 96.7% |
| Mexicans | 0.0 /100 | #327 | Tragic 96.7% |
| Immigrants | Latin America | 0.0 /100 | #328 | Tragic 96.7% |
| Japanese | 0.0 /100 | #329 | Tragic 96.6% |
| Immigrants | Vietnam | 0.0 /100 | #330 | Tragic 96.6% |
| Immigrants | Armenia | 0.0 /100 | #331 | Tragic 96.6% |
| Central Americans | 0.0 /100 | #332 | Tragic 96.5% |
| Immigrants | Dominican Republic | 0.0 /100 | #333 | Tragic 96.5% |
| Bangladeshis | 0.0 /100 | #334 | Tragic 96.5% |
| Yakama | 0.0 /100 | #335 | Tragic 96.5% |
| Guatemalans | 0.0 /100 | #336 | Tragic 96.5% |
Demographics Similar to Immigrants from Norway by 1st Grade
In terms of 1st grade, the demographic groups most similar to Immigrants from Norway are Immigrants from Singapore (98.2%, a difference of 0.0%), Immigrants from Czechoslovakia (98.2%, a difference of 0.0%), Immigrants from Latvia (98.2%, a difference of 0.0%), German Russian (98.2%, a difference of 0.010%), and Ute (98.2%, a difference of 0.010%).
| Demographics | Rating | Rank | 1st Grade |
| Basques | 97.4 /100 | #105 | Exceptional 98.2% |
| Turks | 97.4 /100 | #106 | Exceptional 98.2% |
| Immigrants | Switzerland | 97.3 /100 | #107 | Exceptional 98.2% |
| Bhutanese | 97.3 /100 | #108 | Exceptional 98.2% |
| German Russians | 97.1 /100 | #109 | Exceptional 98.2% |
| Immigrants | Singapore | 96.7 /100 | #110 | Exceptional 98.2% |
| Immigrants | Czechoslovakia | 96.6 /100 | #111 | Exceptional 98.2% |
| Immigrants | Norway | 96.6 /100 | #112 | Exceptional 98.2% |
| Immigrants | Latvia | 96.4 /100 | #113 | Exceptional 98.2% |
| Ute | 96.2 /100 | #114 | Exceptional 98.2% |
| Iranians | 96.0 /100 | #115 | Exceptional 98.2% |
| Spanish | 95.9 /100 | #116 | Exceptional 98.2% |
| Yugoslavians | 95.5 /100 | #117 | Exceptional 98.2% |
| Immigrants | France | 95.5 /100 | #118 | Exceptional 98.2% |
| Thais | 94.7 /100 | #119 | Exceptional 98.1% |