Japanese vs Immigrants from Taiwan 5th Grade
COMPARE
Japanese
Immigrants from Taiwan
5th Grade
5th Grade Comparison
Japanese
Immigrants from Taiwan
95.7%
5TH GRADE
0.0/ 100
METRIC RATING
319th/ 347
METRIC RANK
97.3%
5TH GRADE
48.4/ 100
METRIC RATING
176th/ 347
METRIC RANK
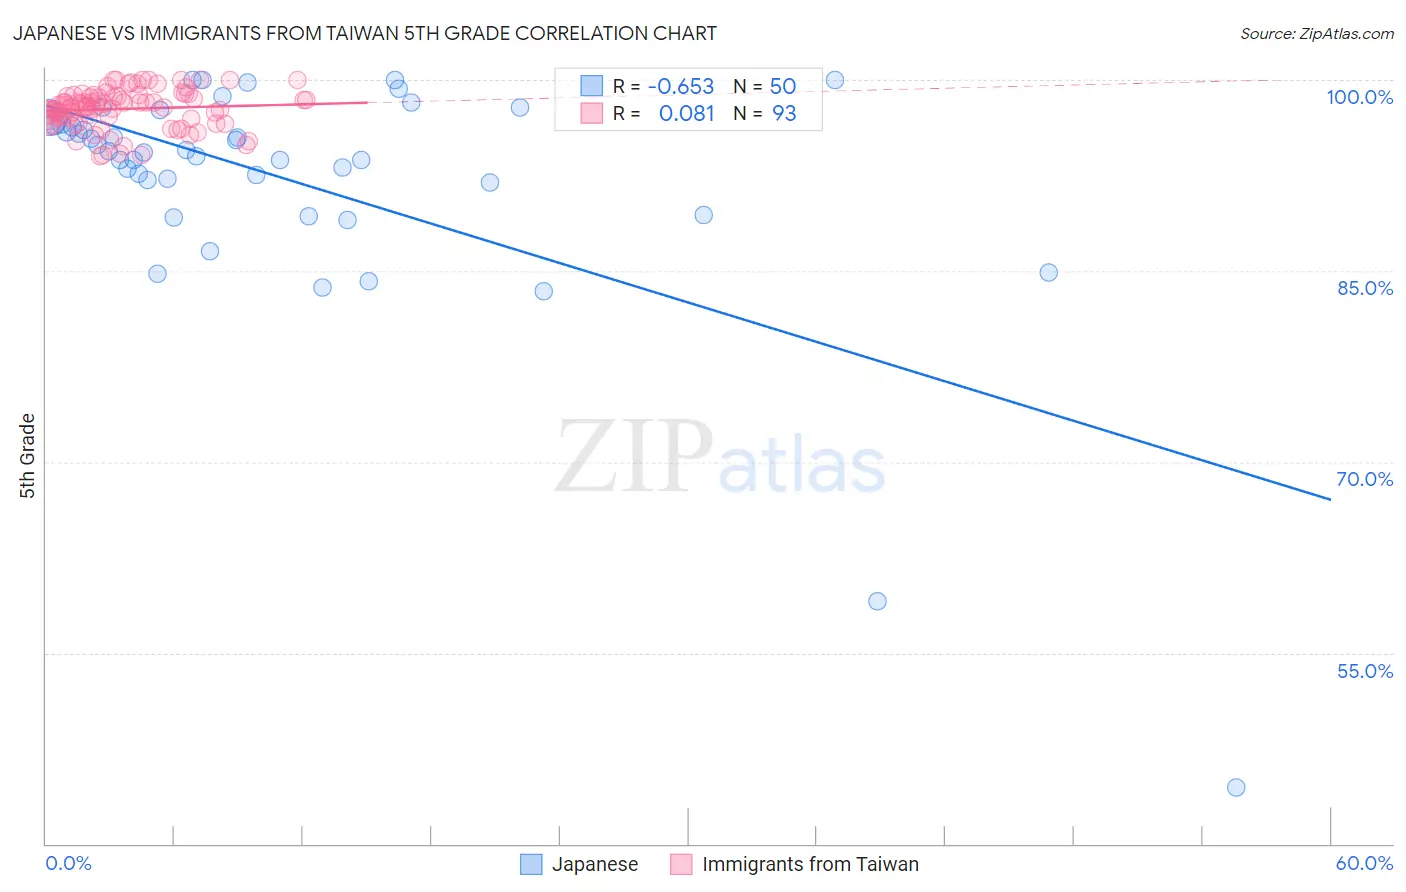
Japanese vs Immigrants from Taiwan 5th Grade Correlation Chart
The statistical analysis conducted on geographies consisting of 249,183,224 people shows a significant negative correlation between the proportion of Japanese and percentage of population with at least 5th grade education in the United States with a correlation coefficient (R) of -0.653 and weighted average of 95.7%. Similarly, the statistical analysis conducted on geographies consisting of 298,069,082 people shows a slight positive correlation between the proportion of Immigrants from Taiwan and percentage of population with at least 5th grade education in the United States with a correlation coefficient (R) of 0.081 and weighted average of 97.3%, a difference of 1.7%.
5th Grade Correlation Summary
| Measurement | Japanese | Immigrants from Taiwan |
| Minimum | 44.4% | 94.0% |
| Maximum | 100.0% | 100.0% |
| Range | 55.6% | 6.0% |
| Mean | 92.2% | 97.7% |
| Median | 94.4% | 98.0% |
| Interquartile 25% (IQ1) | 92.0% | 97.0% |
| Interquartile 75% (IQ3) | 96.5% | 98.7% |
| Interquartile Range (IQR) | 4.5% | 1.7% |
| Standard Deviation (Sample) | 9.6% | 1.5% |
| Standard Deviation (Population) | 9.5% | 1.5% |
Similar Demographics by 5th Grade
Demographics Similar to Japanese by 5th Grade
In terms of 5th grade, the demographic groups most similar to Japanese are Central American Indian (95.7%, a difference of 0.0%), Immigrants from Vietnam (95.8%, a difference of 0.050%), Belizean (95.8%, a difference of 0.070%), Immigrants from Belize (95.7%, a difference of 0.080%), and Immigrants from Nicaragua (95.6%, a difference of 0.090%).
| Demographics | Rating | Rank | 5th Grade |
| Vietnamese | 0.0 /100 | #312 | Tragic 95.9% |
| Bangladeshis | 0.0 /100 | #313 | Tragic 95.9% |
| Immigrants | Portugal | 0.0 /100 | #314 | Tragic 95.9% |
| Nicaraguans | 0.0 /100 | #315 | Tragic 95.9% |
| Immigrants | Ecuador | 0.0 /100 | #316 | Tragic 95.8% |
| Belizeans | 0.0 /100 | #317 | Tragic 95.8% |
| Immigrants | Vietnam | 0.0 /100 | #318 | Tragic 95.8% |
| Japanese | 0.0 /100 | #319 | Tragic 95.7% |
| Central American Indians | 0.0 /100 | #320 | Tragic 95.7% |
| Immigrants | Belize | 0.0 /100 | #321 | Tragic 95.7% |
| Immigrants | Nicaragua | 0.0 /100 | #322 | Tragic 95.6% |
| Immigrants | Fiji | 0.0 /100 | #323 | Tragic 95.6% |
| Hondurans | 0.0 /100 | #324 | Tragic 95.6% |
| Hispanics or Latinos | 0.0 /100 | #325 | Tragic 95.6% |
| Immigrants | Cambodia | 0.0 /100 | #326 | Tragic 95.5% |
Demographics Similar to Immigrants from Taiwan by 5th Grade
In terms of 5th grade, the demographic groups most similar to Immigrants from Taiwan are Immigrants from Micronesia (97.3%, a difference of 0.0%), Immigrants from Kazakhstan (97.3%, a difference of 0.010%), Immigrants from Spain (97.3%, a difference of 0.010%), Immigrants from Korea (97.3%, a difference of 0.020%), and Venezuelan (97.3%, a difference of 0.020%).
| Demographics | Rating | Rank | 5th Grade |
| Immigrants | Korea | 54.1 /100 | #169 | Average 97.3% |
| Venezuelans | 54.0 /100 | #170 | Average 97.3% |
| Immigrants | Sri Lanka | 53.8 /100 | #171 | Average 97.3% |
| Arabs | 53.4 /100 | #172 | Average 97.3% |
| Egyptians | 52.4 /100 | #173 | Average 97.3% |
| Immigrants | Kazakhstan | 50.0 /100 | #174 | Average 97.3% |
| Immigrants | Micronesia | 48.8 /100 | #175 | Average 97.3% |
| Immigrants | Taiwan | 48.4 /100 | #176 | Average 97.3% |
| Immigrants | Spain | 47.0 /100 | #177 | Average 97.3% |
| Comanche | 42.1 /100 | #178 | Average 97.3% |
| Immigrants | Kenya | 40.3 /100 | #179 | Average 97.3% |
| Pakistanis | 40.2 /100 | #180 | Average 97.3% |
| Argentineans | 39.5 /100 | #181 | Fair 97.3% |
| Mongolians | 39.4 /100 | #182 | Fair 97.3% |
| Immigrants | Ukraine | 38.6 /100 | #183 | Fair 97.3% |