Japanese vs Asian Kindergarten
COMPARE
Japanese
Asian
Kindergarten
Kindergarten Comparison
Japanese
Asians
96.7%
KINDERGARTEN
0.0/ 100
METRIC RATING
330th/ 347
METRIC RANK
97.6%
KINDERGARTEN
1.2/ 100
METRIC RATING
243rd/ 347
METRIC RANK
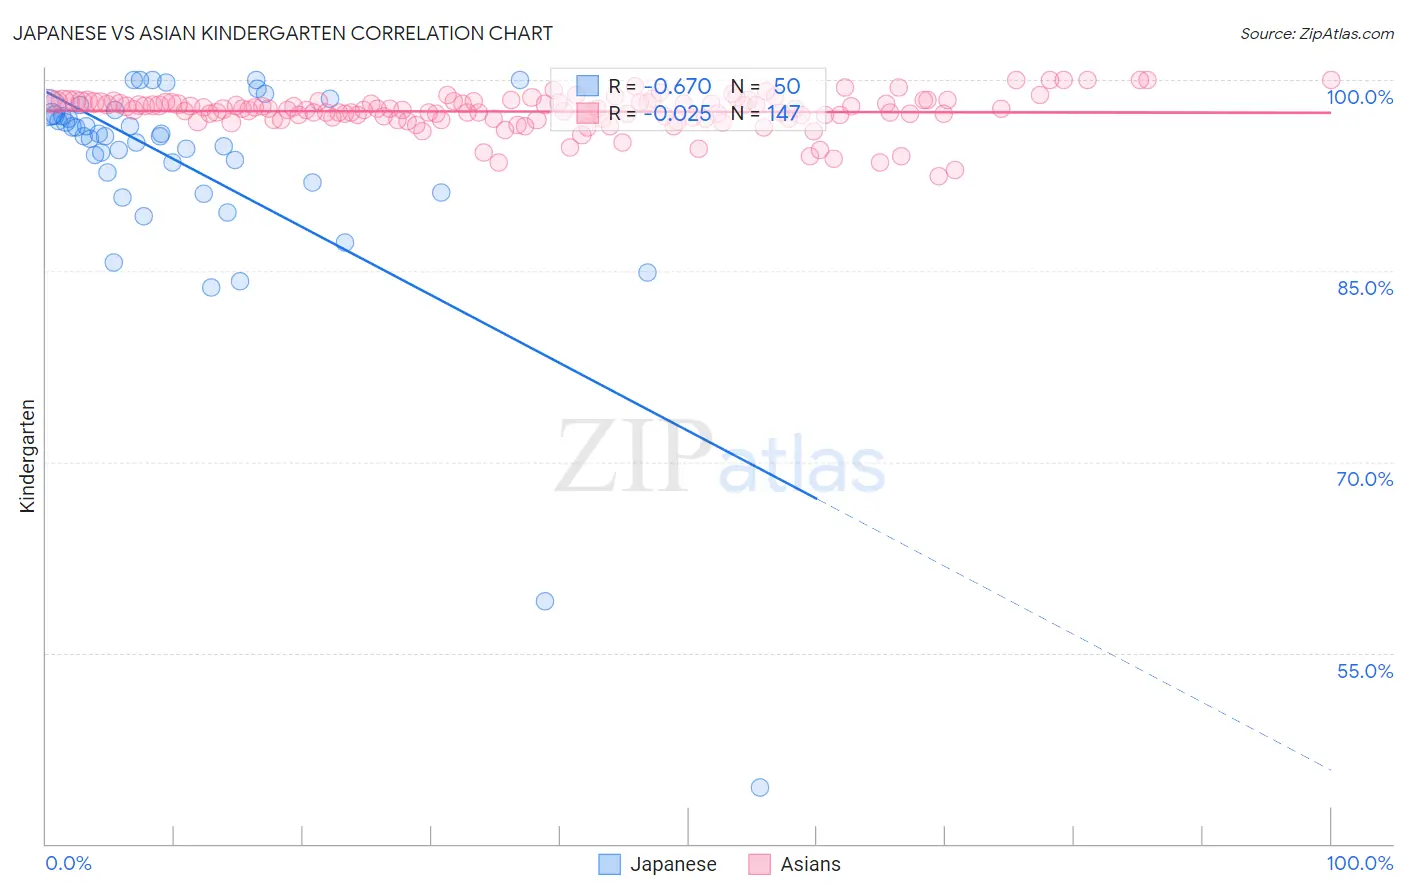
Japanese vs Asian Kindergarten Correlation Chart
The statistical analysis conducted on geographies consisting of 249,183,224 people shows a significant negative correlation between the proportion of Japanese and percentage of population with at least kindergarten education in the United States with a correlation coefficient (R) of -0.670 and weighted average of 96.7%. Similarly, the statistical analysis conducted on geographies consisting of 550,722,447 people shows no correlation between the proportion of Asians and percentage of population with at least kindergarten education in the United States with a correlation coefficient (R) of -0.025 and weighted average of 97.6%, a difference of 0.99%.
Kindergarten Correlation Summary
| Measurement | Japanese | Asian |
| Minimum | 44.4% | 92.4% |
| Maximum | 100.0% | 100.0% |
| Range | 55.6% | 7.6% |
| Mean | 93.0% | 97.5% |
| Median | 95.6% | 97.7% |
| Interquartile 25% (IQ1) | 92.0% | 97.0% |
| Interquartile 75% (IQ3) | 97.3% | 98.3% |
| Interquartile Range (IQR) | 5.3% | 1.3% |
| Standard Deviation (Sample) | 9.6% | 1.4% |
| Standard Deviation (Population) | 9.5% | 1.4% |
Similar Demographics by Kindergarten
Demographics Similar to Japanese by Kindergarten
In terms of kindergarten, the demographic groups most similar to Japanese are Immigrants from Vietnam (96.7%, a difference of 0.0%), Immigrants from Armenia (96.6%, a difference of 0.030%), Immigrants from Latin America (96.7%, a difference of 0.050%), Yakama (96.6%, a difference of 0.050%), and Mexican (96.7%, a difference of 0.060%).
| Demographics | Rating | Rank | Kindergarten |
| Immigrants | Honduras | 0.0 /100 | #323 | Tragic 96.8% |
| Vietnamese | 0.0 /100 | #324 | Tragic 96.8% |
| Indonesians | 0.0 /100 | #325 | Tragic 96.8% |
| Dominicans | 0.0 /100 | #326 | Tragic 96.8% |
| Mexicans | 0.0 /100 | #327 | Tragic 96.7% |
| Immigrants | Latin America | 0.0 /100 | #328 | Tragic 96.7% |
| Immigrants | Vietnam | 0.0 /100 | #329 | Tragic 96.7% |
| Japanese | 0.0 /100 | #330 | Tragic 96.7% |
| Immigrants | Armenia | 0.0 /100 | #331 | Tragic 96.6% |
| Yakama | 0.0 /100 | #332 | Tragic 96.6% |
| Central Americans | 0.0 /100 | #333 | Tragic 96.6% |
| Immigrants | Dominican Republic | 0.0 /100 | #334 | Tragic 96.6% |
| Bangladeshis | 0.0 /100 | #335 | Tragic 96.6% |
| Guatemalans | 0.0 /100 | #336 | Tragic 96.5% |
| Immigrants | Cambodia | 0.0 /100 | #337 | Tragic 96.5% |
Demographics Similar to Asians by Kindergarten
In terms of kindergarten, the demographic groups most similar to Asians are Bolivian (97.6%, a difference of 0.0%), Liberian (97.6%, a difference of 0.010%), Immigrants from Indonesia (97.6%, a difference of 0.010%), South American (97.6%, a difference of 0.010%), and Indian (Asian) (97.6%, a difference of 0.010%).
| Demographics | Rating | Rank | Kindergarten |
| Immigrants | Western Asia | 2.1 /100 | #236 | Tragic 97.7% |
| Nigerians | 1.8 /100 | #237 | Tragic 97.6% |
| Immigrants | Eastern Asia | 1.7 /100 | #238 | Tragic 97.6% |
| U.S. Virgin Islanders | 1.7 /100 | #239 | Tragic 97.6% |
| Koreans | 1.6 /100 | #240 | Tragic 97.6% |
| Liberians | 1.3 /100 | #241 | Tragic 97.6% |
| Immigrants | Indonesia | 1.3 /100 | #242 | Tragic 97.6% |
| Asians | 1.2 /100 | #243 | Tragic 97.6% |
| Bolivians | 1.2 /100 | #244 | Tragic 97.6% |
| South Americans | 1.1 /100 | #245 | Tragic 97.6% |
| Indians (Asian) | 1.0 /100 | #246 | Tragic 97.6% |
| Immigrants | Eastern Africa | 1.0 /100 | #247 | Tragic 97.6% |
| Immigrants | Middle Africa | 1.0 /100 | #248 | Tragic 97.6% |
| Peruvians | 1.0 /100 | #249 | Tragic 97.6% |
| Immigrants | Senegal | 0.9 /100 | #250 | Tragic 97.6% |