Immigrants from Western Asia vs Welsh 5th Grade
COMPARE
Immigrants from Western Asia
Welsh
5th Grade
5th Grade Comparison
Immigrants from Western Asia
Welsh
97.0%
5TH GRADE
4.3/ 100
METRIC RATING
230th/ 347
METRIC RANK
98.6%
5TH GRADE
100.0/ 100
METRIC RATING
2nd/ 347
METRIC RANK
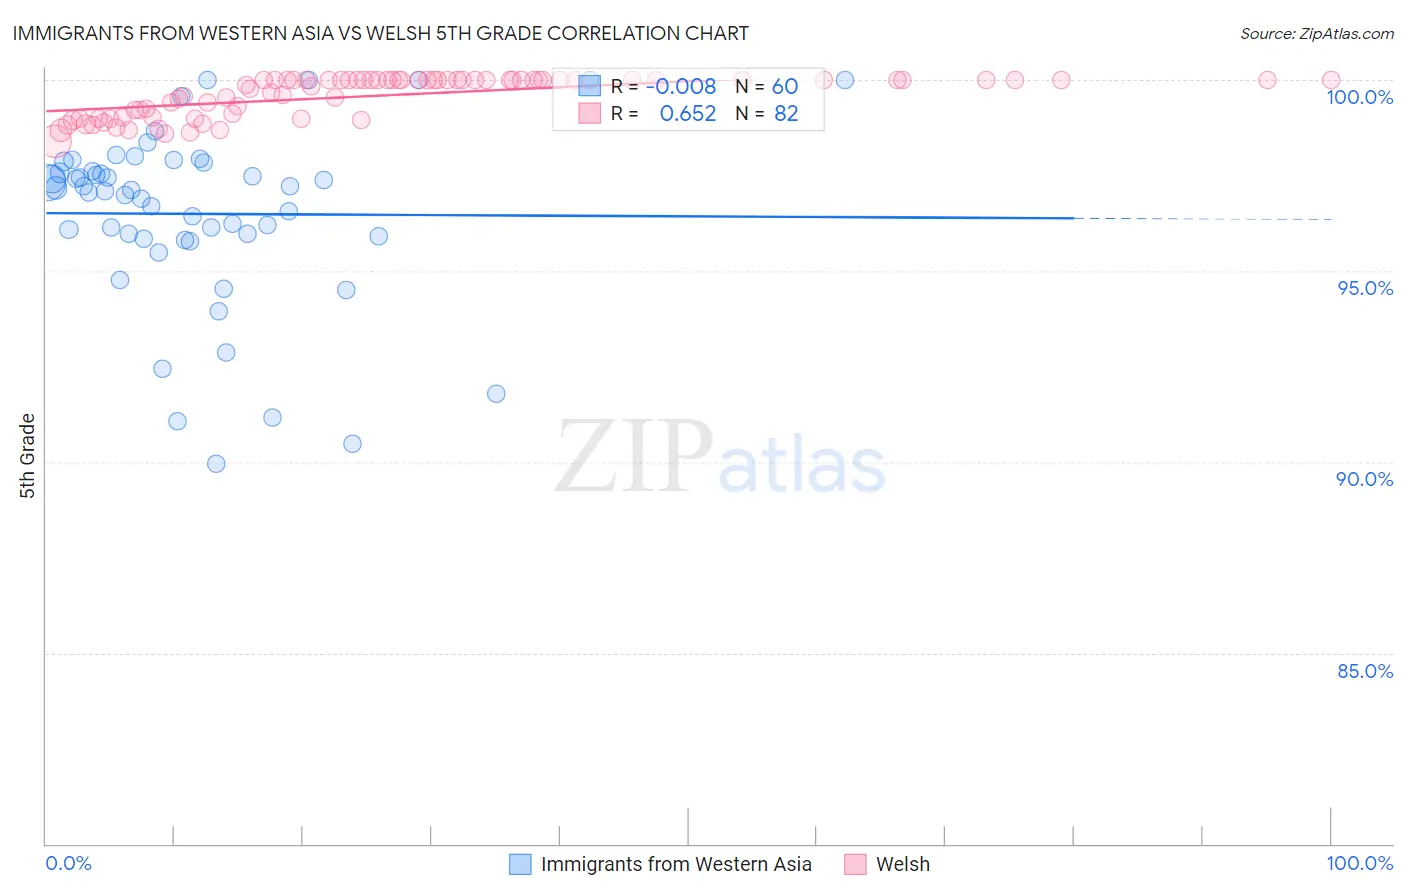
Immigrants from Western Asia vs Welsh 5th Grade Correlation Chart
The statistical analysis conducted on geographies consisting of 404,424,892 people shows no correlation between the proportion of Immigrants from Western Asia and percentage of population with at least 5th grade education in the United States with a correlation coefficient (R) of -0.008 and weighted average of 97.0%. Similarly, the statistical analysis conducted on geographies consisting of 239,959,962 people shows a significant positive correlation between the proportion of Welsh and percentage of population with at least 5th grade education in the United States with a correlation coefficient (R) of 0.652 and weighted average of 98.6%, a difference of 1.6%.
5th Grade Correlation Summary
| Measurement | Immigrants from Western Asia | Welsh |
| Minimum | 90.0% | 98.4% |
| Maximum | 100.0% | 100.0% |
| Range | 10.0% | 1.6% |
| Mean | 96.5% | 99.6% |
| Median | 97.1% | 100.0% |
| Interquartile 25% (IQ1) | 95.9% | 99.0% |
| Interquartile 75% (IQ3) | 97.7% | 100.0% |
| Interquartile Range (IQR) | 1.9% | 0.99% |
| Standard Deviation (Sample) | 2.3% | 0.52% |
| Standard Deviation (Population) | 2.3% | 0.51% |
Similar Demographics by 5th Grade
Demographics Similar to Immigrants from Western Asia by 5th Grade
In terms of 5th grade, the demographic groups most similar to Immigrants from Western Asia are Assyrian/Chaldean/Syriac (97.0%, a difference of 0.0%), Yuman (97.0%, a difference of 0.0%), Immigrants from Pakistan (97.0%, a difference of 0.010%), Immigrants from Malaysia (97.0%, a difference of 0.010%), and Immigrants from Eastern Asia (97.0%, a difference of 0.010%).
| Demographics | Rating | Rank | 5th Grade |
| Liberians | 5.7 /100 | #223 | Tragic 97.0% |
| South American Indians | 5.4 /100 | #224 | Tragic 97.0% |
| Bahamians | 5.3 /100 | #225 | Tragic 97.0% |
| Tongans | 5.3 /100 | #226 | Tragic 97.0% |
| Immigrants | Pakistan | 4.7 /100 | #227 | Tragic 97.0% |
| Assyrians/Chaldeans/Syriacs | 4.5 /100 | #228 | Tragic 97.0% |
| Yuman | 4.5 /100 | #229 | Tragic 97.0% |
| Immigrants | Western Asia | 4.3 /100 | #230 | Tragic 97.0% |
| Immigrants | Malaysia | 4.1 /100 | #231 | Tragic 97.0% |
| Immigrants | Eastern Asia | 4.0 /100 | #232 | Tragic 97.0% |
| Sub-Saharan Africans | 3.3 /100 | #233 | Tragic 97.0% |
| Tohono O'odham | 3.2 /100 | #234 | Tragic 97.0% |
| Uruguayans | 3.2 /100 | #235 | Tragic 97.0% |
| Senegalese | 2.8 /100 | #236 | Tragic 97.0% |
| Immigrants | Indonesia | 2.0 /100 | #237 | Tragic 96.9% |
Demographics Similar to Welsh by 5th Grade
In terms of 5th grade, the demographic groups most similar to Welsh are Norwegian (98.4%, a difference of 0.20%), Tsimshian (98.4%, a difference of 0.20%), Slovak (98.4%, a difference of 0.22%), German (98.4%, a difference of 0.22%), and Inupiat (98.4%, a difference of 0.25%).
| Demographics | Rating | Rank | 5th Grade |
| Crow | 100.0 /100 | #1 | Exceptional 99.5% |
| Welsh | 100.0 /100 | #2 | Exceptional 98.6% |
| Norwegians | 100.0 /100 | #3 | Exceptional 98.4% |
| Tsimshian | 100.0 /100 | #4 | Exceptional 98.4% |
| Slovaks | 100.0 /100 | #5 | Exceptional 98.4% |
| Germans | 100.0 /100 | #6 | Exceptional 98.4% |
| Inupiat | 100.0 /100 | #7 | Exceptional 98.4% |
| Slovenes | 100.0 /100 | #8 | Exceptional 98.3% |
| Swedes | 100.0 /100 | #9 | Exceptional 98.3% |
| English | 100.0 /100 | #10 | Exceptional 98.3% |
| Alaskan Athabascans | 100.0 /100 | #11 | Exceptional 98.3% |
| Carpatho Rusyns | 100.0 /100 | #12 | Exceptional 98.3% |
| Tlingit-Haida | 100.0 /100 | #13 | Exceptional 98.3% |
| Dutch | 100.0 /100 | #14 | Exceptional 98.3% |
| Scottish | 100.0 /100 | #15 | Exceptional 98.3% |