Immigrants from Belize vs Welsh 5th Grade
COMPARE
Immigrants from Belize
Welsh
5th Grade
5th Grade Comparison
Immigrants from Belize
Welsh
95.7%
5TH GRADE
0.0/ 100
METRIC RATING
321st/ 347
METRIC RANK
98.6%
5TH GRADE
100.0/ 100
METRIC RATING
2nd/ 347
METRIC RANK
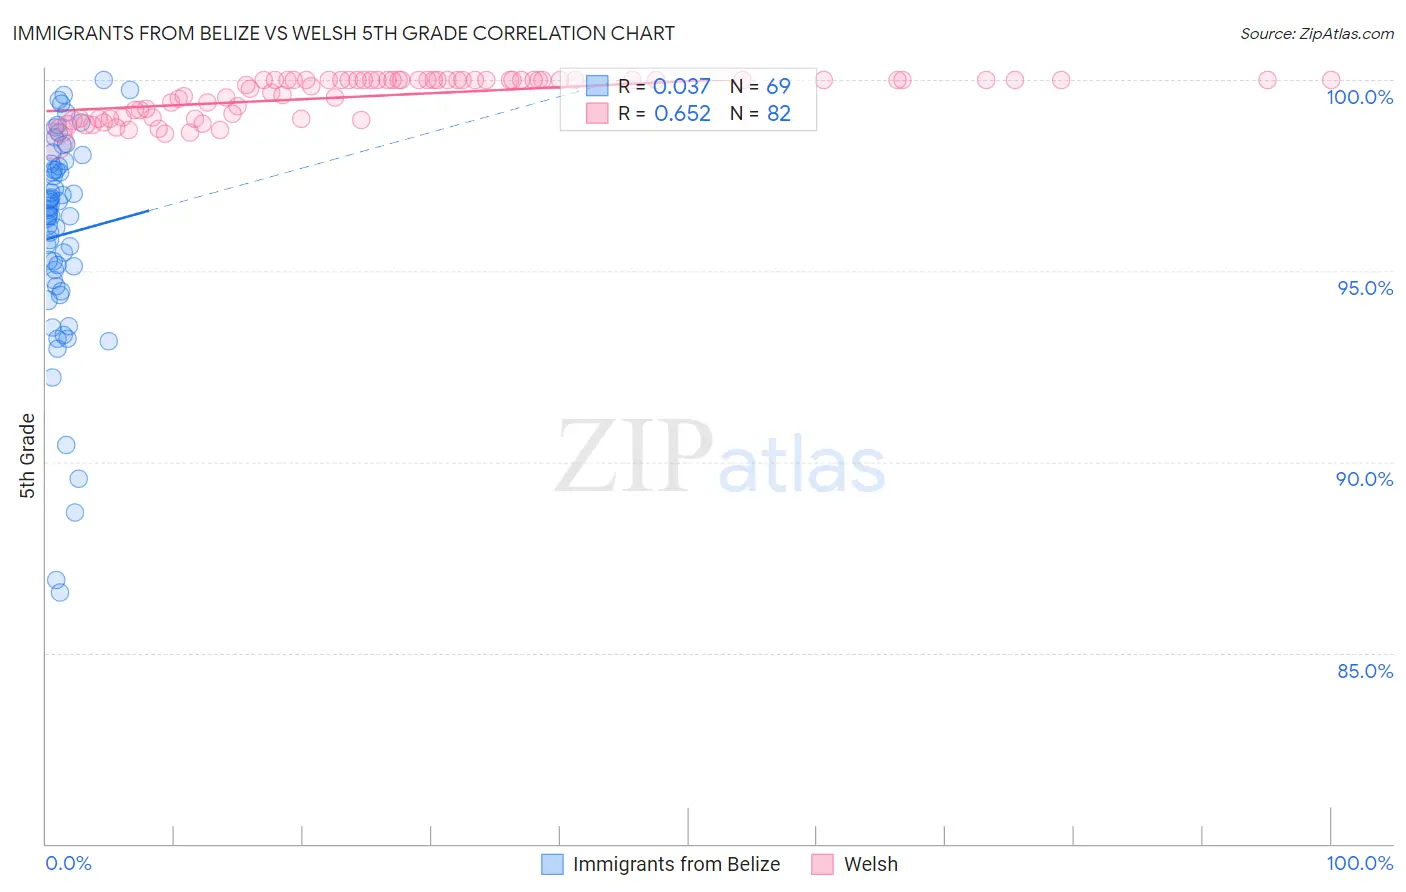
Immigrants from Belize vs Welsh 5th Grade Correlation Chart
The statistical analysis conducted on geographies consisting of 130,328,311 people shows no correlation between the proportion of Immigrants from Belize and percentage of population with at least 5th grade education in the United States with a correlation coefficient (R) of 0.037 and weighted average of 95.7%. Similarly, the statistical analysis conducted on geographies consisting of 239,959,962 people shows a significant positive correlation between the proportion of Welsh and percentage of population with at least 5th grade education in the United States with a correlation coefficient (R) of 0.652 and weighted average of 98.6%, a difference of 3.1%.
5th Grade Correlation Summary
| Measurement | Immigrants from Belize | Welsh |
| Minimum | 86.6% | 98.4% |
| Maximum | 100.0% | 100.0% |
| Range | 13.4% | 1.6% |
| Mean | 95.9% | 99.6% |
| Median | 96.5% | 100.0% |
| Interquartile 25% (IQ1) | 94.7% | 99.0% |
| Interquartile 75% (IQ3) | 97.8% | 100.0% |
| Interquartile Range (IQR) | 3.1% | 0.99% |
| Standard Deviation (Sample) | 2.8% | 0.52% |
| Standard Deviation (Population) | 2.8% | 0.51% |
Similar Demographics by 5th Grade
Demographics Similar to Immigrants from Belize by 5th Grade
In terms of 5th grade, the demographic groups most similar to Immigrants from Belize are Immigrants from Nicaragua (95.6%, a difference of 0.020%), Immigrants from Fiji (95.6%, a difference of 0.070%), Japanese (95.7%, a difference of 0.080%), Central American Indian (95.7%, a difference of 0.080%), and Honduran (95.6%, a difference of 0.090%).
| Demographics | Rating | Rank | 5th Grade |
| Immigrants | Portugal | 0.0 /100 | #314 | Tragic 95.9% |
| Nicaraguans | 0.0 /100 | #315 | Tragic 95.9% |
| Immigrants | Ecuador | 0.0 /100 | #316 | Tragic 95.8% |
| Belizeans | 0.0 /100 | #317 | Tragic 95.8% |
| Immigrants | Vietnam | 0.0 /100 | #318 | Tragic 95.8% |
| Japanese | 0.0 /100 | #319 | Tragic 95.7% |
| Central American Indians | 0.0 /100 | #320 | Tragic 95.7% |
| Immigrants | Belize | 0.0 /100 | #321 | Tragic 95.7% |
| Immigrants | Nicaragua | 0.0 /100 | #322 | Tragic 95.6% |
| Immigrants | Fiji | 0.0 /100 | #323 | Tragic 95.6% |
| Hondurans | 0.0 /100 | #324 | Tragic 95.6% |
| Hispanics or Latinos | 0.0 /100 | #325 | Tragic 95.6% |
| Immigrants | Cambodia | 0.0 /100 | #326 | Tragic 95.5% |
| Dominicans | 0.0 /100 | #327 | Tragic 95.5% |
| Cape Verdeans | 0.0 /100 | #328 | Tragic 95.5% |
Demographics Similar to Welsh by 5th Grade
In terms of 5th grade, the demographic groups most similar to Welsh are Norwegian (98.4%, a difference of 0.20%), Tsimshian (98.4%, a difference of 0.20%), Slovak (98.4%, a difference of 0.22%), German (98.4%, a difference of 0.22%), and Inupiat (98.4%, a difference of 0.25%).
| Demographics | Rating | Rank | 5th Grade |
| Crow | 100.0 /100 | #1 | Exceptional 99.5% |
| Welsh | 100.0 /100 | #2 | Exceptional 98.6% |
| Norwegians | 100.0 /100 | #3 | Exceptional 98.4% |
| Tsimshian | 100.0 /100 | #4 | Exceptional 98.4% |
| Slovaks | 100.0 /100 | #5 | Exceptional 98.4% |
| Germans | 100.0 /100 | #6 | Exceptional 98.4% |
| Inupiat | 100.0 /100 | #7 | Exceptional 98.4% |
| Slovenes | 100.0 /100 | #8 | Exceptional 98.3% |
| Swedes | 100.0 /100 | #9 | Exceptional 98.3% |
| English | 100.0 /100 | #10 | Exceptional 98.3% |
| Alaskan Athabascans | 100.0 /100 | #11 | Exceptional 98.3% |
| Carpatho Rusyns | 100.0 /100 | #12 | Exceptional 98.3% |
| Tlingit-Haida | 100.0 /100 | #13 | Exceptional 98.3% |
| Dutch | 100.0 /100 | #14 | Exceptional 98.3% |
| Scottish | 100.0 /100 | #15 | Exceptional 98.3% |