Italian vs Immigrants from Bangladesh 4th Grade
COMPARE
Italian
Immigrants from Bangladesh
4th Grade
4th Grade Comparison
Italians
Immigrants from Bangladesh
98.2%
4TH GRADE
100.0/ 100
METRIC RATING
35th/ 347
METRIC RANK
96.2%
4TH GRADE
0.0/ 100
METRIC RATING
311th/ 347
METRIC RANK
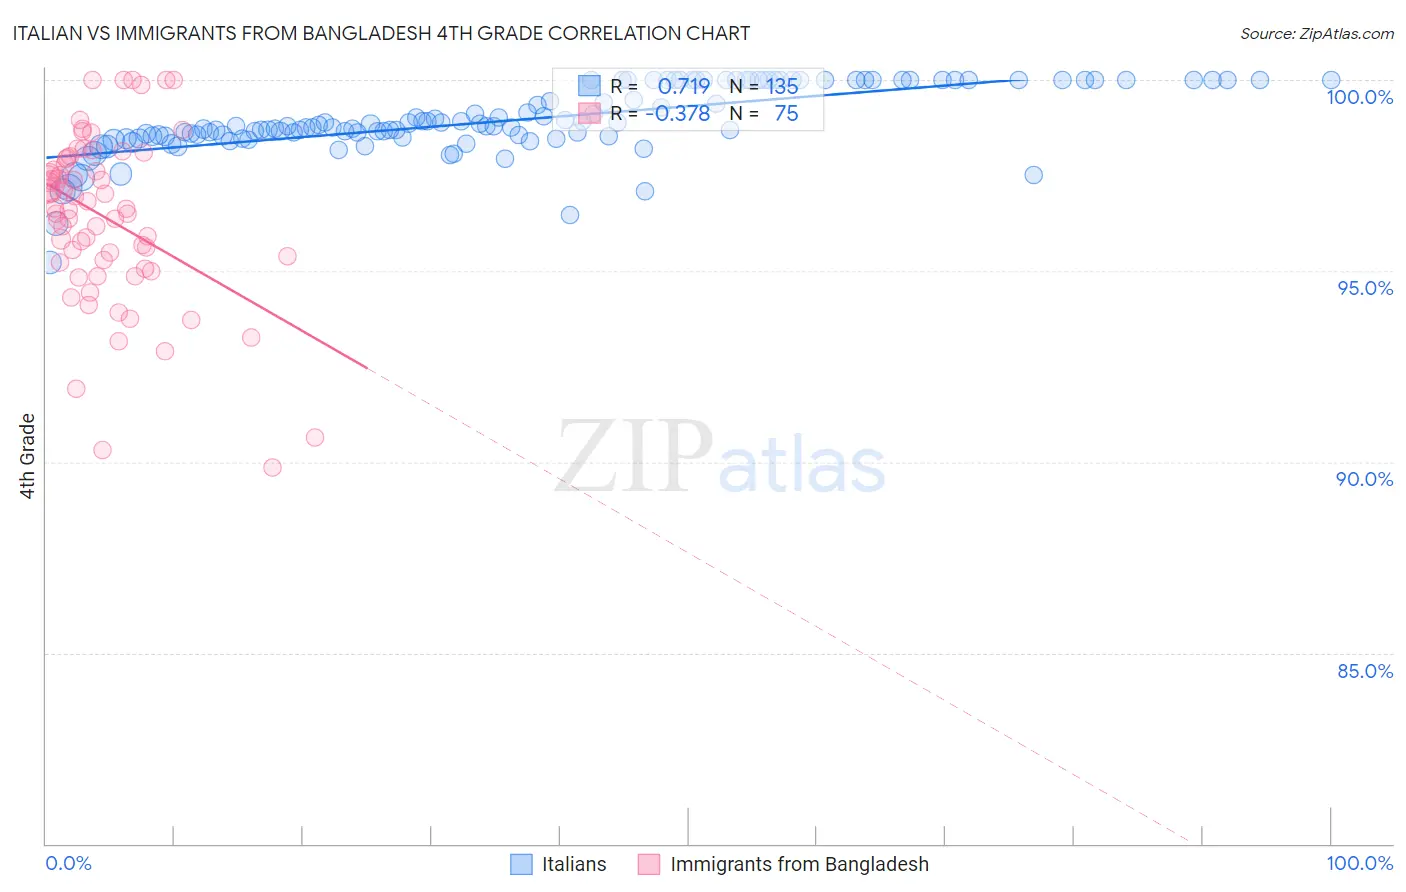
Italian vs Immigrants from Bangladesh 4th Grade Correlation Chart
The statistical analysis conducted on geographies consisting of 575,115,824 people shows a strong positive correlation between the proportion of Italians and percentage of population with at least 4th grade education in the United States with a correlation coefficient (R) of 0.719 and weighted average of 98.2%. Similarly, the statistical analysis conducted on geographies consisting of 203,671,281 people shows a mild negative correlation between the proportion of Immigrants from Bangladesh and percentage of population with at least 4th grade education in the United States with a correlation coefficient (R) of -0.378 and weighted average of 96.2%, a difference of 2.1%.
4th Grade Correlation Summary
| Measurement | Italian | Immigrants from Bangladesh |
| Minimum | 95.2% | 89.8% |
| Maximum | 100.0% | 100.0% |
| Range | 4.8% | 10.2% |
| Mean | 98.9% | 96.4% |
| Median | 98.8% | 96.6% |
| Interquartile 25% (IQ1) | 98.5% | 95.2% |
| Interquartile 75% (IQ3) | 100.0% | 97.9% |
| Interquartile Range (IQR) | 1.5% | 2.7% |
| Standard Deviation (Sample) | 0.89% | 2.2% |
| Standard Deviation (Population) | 0.88% | 2.2% |
Similar Demographics by 4th Grade
Demographics Similar to Italians by 4th Grade
In terms of 4th grade, the demographic groups most similar to Italians are Chippewa (98.2%, a difference of 0.0%), Swiss (98.2%, a difference of 0.010%), British (98.2%, a difference of 0.010%), Chinese (98.3%, a difference of 0.020%), and Latvian (98.2%, a difference of 0.030%).
| Demographics | Rating | Rank | 4th Grade |
| French | 100.0 /100 | #28 | Exceptional 98.3% |
| Czechs | 100.0 /100 | #29 | Exceptional 98.3% |
| Scandinavians | 100.0 /100 | #30 | Exceptional 98.3% |
| Europeans | 100.0 /100 | #31 | Exceptional 98.3% |
| Chinese | 100.0 /100 | #32 | Exceptional 98.3% |
| Swiss | 100.0 /100 | #33 | Exceptional 98.2% |
| Chippewa | 100.0 /100 | #34 | Exceptional 98.2% |
| Italians | 100.0 /100 | #35 | Exceptional 98.2% |
| British | 100.0 /100 | #36 | Exceptional 98.2% |
| Latvians | 99.9 /100 | #37 | Exceptional 98.2% |
| Aleuts | 99.9 /100 | #38 | Exceptional 98.2% |
| Belgians | 99.9 /100 | #39 | Exceptional 98.2% |
| Luxembourgers | 99.9 /100 | #40 | Exceptional 98.2% |
| Eastern Europeans | 99.9 /100 | #41 | Exceptional 98.2% |
| Hungarians | 99.9 /100 | #42 | Exceptional 98.2% |
Demographics Similar to Immigrants from Bangladesh by 4th Grade
In terms of 4th grade, the demographic groups most similar to Immigrants from Bangladesh are Cape Verdean (96.2%, a difference of 0.010%), Indonesian (96.2%, a difference of 0.020%), Vietnamese (96.2%, a difference of 0.030%), Nicaraguan (96.2%, a difference of 0.030%), and Immigrants from Ecuador (96.2%, a difference of 0.040%).
| Demographics | Rating | Rank | 4th Grade |
| Ecuadorians | 0.0 /100 | #304 | Tragic 96.4% |
| Immigrants | Caribbean | 0.0 /100 | #305 | Tragic 96.4% |
| Sri Lankans | 0.0 /100 | #306 | Tragic 96.4% |
| Immigrants | Haiti | 0.0 /100 | #307 | Tragic 96.3% |
| Immigrants | Laos | 0.0 /100 | #308 | Tragic 96.3% |
| Immigrants | Guyana | 0.0 /100 | #309 | Tragic 96.3% |
| Immigrants | Burma/Myanmar | 0.0 /100 | #310 | Tragic 96.3% |
| Immigrants | Bangladesh | 0.0 /100 | #311 | Tragic 96.2% |
| Cape Verdeans | 0.0 /100 | #312 | Tragic 96.2% |
| Indonesians | 0.0 /100 | #313 | Tragic 96.2% |
| Vietnamese | 0.0 /100 | #314 | Tragic 96.2% |
| Nicaraguans | 0.0 /100 | #315 | Tragic 96.2% |
| Immigrants | Ecuador | 0.0 /100 | #316 | Tragic 96.2% |
| Central American Indians | 0.0 /100 | #317 | Tragic 96.2% |
| Immigrants | Azores | 0.0 /100 | #318 | Tragic 96.1% |