Italian vs Immigrants from Chile 5th Grade

COMPARE

Italian
Race
Ancestry
AfghanAfricanAlaska NativeAlaskan AthabascanAlbanianAleutAlsatianAmericanApacheArabArapahoArgentineanArmenianAssyrian/Chaldean/SyriacAustralianAustrianBahamianBangladeshiBarbadianBasqueBelgianBelizeanBermudanBhutaneseBlackfeetBolivianBrazilianBritishBritish West IndianBulgarianBurmeseCajunCambodianCanadianCape VerdeanCarpatho RusynCelticCentral AmericanCentral American IndianCherokeeCheyenneChickasawChileanChineseChippewaChoctawColombianColvilleComancheCosta RicanCreeCreekCroatianCrowCubanCypriotCzechCzechoslovakianDanishDelawareDominicanDutchDutch West IndianEastern EuropeanEcuadorianEgyptianEnglishEstonianEthiopianEuropeanFijianFilipinoFinnishFrenchFrench American IndianFrench CanadianGermanGerman RussianGhanaianGreekGuamanian/ChamorroGuatemalanGuyaneseHaitianHmongHonduranHopiHoumaHungarianIcelanderIndian (Asian)IndonesianInupiatIranianIraqiIrishIroquoisIsraeliItalianJamaicanJapaneseJordanianKenyanKiowaKoreanLaotianLatvianLebaneseLiberianLithuanianLumbeeLuxembourgerMacedonianMalaysianMalteseMarshalleseMenomineeMexicanMexican American IndianMongolianMoroccanNative HawaiianNavajoNepaleseNew ZealanderNicaraguanNigerianNorthern EuropeanNorwegianOkinawanOsageOttawaPaiutePakistaniPalestinianPanamanianParaguayanPennsylvania GermanPeruvianPimaPolishPortuguesePotawatomiPuebloPuerto RicanPuget Sound SalishRomanianRussianSalvadoranSamoanScandinavianScotch-IrishScottishSeminoleSenegaleseSerbianShoshoneSierra LeoneanSiouxSlavicSlovakSloveneSomaliSouth AfricanSouth AmericanSouth American IndianSoviet UnionSpaniardSpanishSpanish AmericanSpanish American IndianSri LankanSubsaharan AfricanSudaneseSwedishSwissSyrianTaiwaneseThaiTlingit-HaidaTohono O'OdhamTonganTrinidadian and TobagonianTsimshianTurkishU.S. Virgin IslanderUgandanUkrainianUruguayanUteVenezuelanVietnameseWelshWest IndianYakamaYaquiYugoslavianYumanYup'ikZimbabwean
Immigration
NonimmigrantsImmigrantsAfghanistanAfricaAlbaniaArgentinaArmeniaAsiaAustraliaAustriaBahamasBangladeshBarbadosBelarusBelgiumBelizeBoliviaBosnia and HerzegovinaBrazilBulgariaBurma/MyanmarCabo VerdeCambodiaCameroonCanadaCaribbeanCentral AmericaChinaColombiaCongoCosta RicaCroatiaCubaCzechoslovakiaDenmarkDominicaDominican RepublicEastern AfricaEastern AsiaEastern EuropeEcuadorEgyptEl SalvadorEnglandEritreaEthiopiaEuropeFijiFranceGermanyGhanaGreeceGrenadaGuatemalaGuyanaHaitiHondurasHong KongHungaryIndiaIndonesiaIranIraqIrelandIsraelItalyJamaicaJapanJordanKazakhstanKenyaKoreaKuwaitLaosLatin AmericaLatviaLebanonLiberiaLithuaniaMalaysiaMexicoMicronesiaMiddle AfricaMoldovaMoroccoNepalNetherlandsNicaraguaNigeriaNorth AmericaNorth MacedoniaNorthern AfricaNorthern EuropeNorwayOceaniaPakistanPanamaPeruPhilippinesPolandPortugalRomaniaRussiaSaudi ArabiaScotlandSenegalSerbiaSierra LeoneSingaporeSomaliaSouth AfricaSouth AmericaSouth Central AsiaSouth Eastern AsiaSouthern EuropeSpainSri LankaSt. Vincent and the GrenadinesSudanSwedenSwitzerlandSyriaTaiwanThailandTrinidad and TobagoTurkeyUgandaUkraineUruguayUzbekistanVenezuelaVietnamWest IndiesWestern AfricaWestern AsiaWestern EuropeYemenZaireZimbabweAzores
Immigrants from Chile
Race
Ancestry
AfghanAfricanAlaska NativeAlaskan AthabascanAlbanianAleutAlsatianAmericanApacheArabArapahoArgentineanArmenianAssyrian/Chaldean/SyriacAustralianAustrianBahamianBangladeshiBarbadianBasqueBelgianBelizeanBermudanBhutaneseBlackfeetBolivianBrazilianBritishBritish West IndianBulgarianBurmeseCajunCambodianCanadianCape VerdeanCarpatho RusynCelticCentral AmericanCentral American IndianCherokeeCheyenneChickasawChileanChineseChippewaChoctawColombianColvilleComancheCosta RicanCreeCreekCroatianCrowCubanCypriotCzechCzechoslovakianDanishDelawareDominicanDutchDutch West IndianEastern EuropeanEcuadorianEgyptianEnglishEstonianEthiopianEuropeanFijianFilipinoFinnishFrenchFrench American IndianFrench CanadianGermanGerman RussianGhanaianGreekGuamanian/ChamorroGuatemalanGuyaneseHaitianHmongHonduranHopiHoumaHungarianIcelanderIndian (Asian)IndonesianInupiatIranianIraqiIrishIroquoisIsraeliJamaicanJapaneseJordanianKenyanKiowaKoreanLaotianLatvianLebaneseLiberianLithuanianLumbeeLuxembourgerMacedonianMalaysianMalteseMarshalleseMenomineeMexicanMexican American IndianMongolianMoroccanNative HawaiianNavajoNepaleseNew ZealanderNicaraguanNigerianNorthern EuropeanNorwegianOkinawanOsageOttawaPaiutePakistaniPalestinianPanamanianParaguayanPennsylvania GermanPeruvianPimaPolishPortuguesePotawatomiPuebloPuerto RicanPuget Sound SalishRomanianRussianSalvadoranSamoanScandinavianScotch-IrishScottishSeminoleSenegaleseSerbianShoshoneSierra LeoneanSiouxSlavicSlovakSloveneSomaliSouth AfricanSouth AmericanSouth American IndianSoviet UnionSpaniardSpanishSpanish AmericanSpanish American IndianSri LankanSubsaharan AfricanSudaneseSwedishSwissSyrianTaiwaneseThaiTlingit-HaidaTohono O'OdhamTonganTrinidadian and TobagonianTsimshianTurkishU.S. Virgin IslanderUgandanUkrainianUruguayanUteVenezuelanVietnameseWelshWest IndianYakamaYaquiYugoslavianYumanYup'ikZimbabwean
Immigration
NonimmigrantsImmigrantsAfghanistanAfricaAlbaniaArgentinaArmeniaAsiaAustraliaAustriaBahamasBangladeshBarbadosBelarusBelgiumBelizeBoliviaBosnia and HerzegovinaBrazilBulgariaBurma/MyanmarCabo VerdeCambodiaCameroonCanadaCaribbeanCentral AmericaChileChinaColombiaCongoCosta RicaCroatiaCubaCzechoslovakiaDenmarkDominicaDominican RepublicEastern AfricaEastern AsiaEastern EuropeEcuadorEgyptEl SalvadorEnglandEritreaEthiopiaEuropeFijiFranceGermanyGhanaGreeceGrenadaGuatemalaGuyanaHaitiHondurasHong KongHungaryIndiaIndonesiaIranIraqIrelandIsraelItalyJamaicaJapanJordanKazakhstanKenyaKoreaKuwaitLaosLatin AmericaLatviaLebanonLiberiaLithuaniaMalaysiaMexicoMicronesiaMiddle AfricaMoldovaMoroccoNepalNetherlandsNicaraguaNigeriaNorth AmericaNorth MacedoniaNorthern AfricaNorthern EuropeNorwayOceaniaPakistanPanamaPeruPhilippinesPolandPortugalRomaniaRussiaSaudi ArabiaScotlandSenegalSerbiaSierra LeoneSingaporeSomaliaSouth AfricaSouth AmericaSouth Central AsiaSouth Eastern AsiaSouthern EuropeSpainSri LankaSt. Vincent and the GrenadinesSudanSwedenSwitzerlandSyriaTaiwanThailandTrinidad and TobagoTurkeyUgandaUkraineUruguayUzbekistanVenezuelaVietnamWest IndiesWestern AfricaWestern AsiaWestern EuropeYemenZaireZimbabweAzores
5th Grade
Income
Poverty
Unemployment
Labor Participation
Family Structure
Vehicle Availability
Education Level
Disability

5th Grade Comparison

Italians

Immigrants from Chile

Exceptional
Poor
98.1%
5TH GRADE
100.0/ 100
METRIC RATING
35th/ 347
METRIC RANK
97.2%
5TH GRADE
16.6/ 100
METRIC RATING
201st/ 347
METRIC RANK

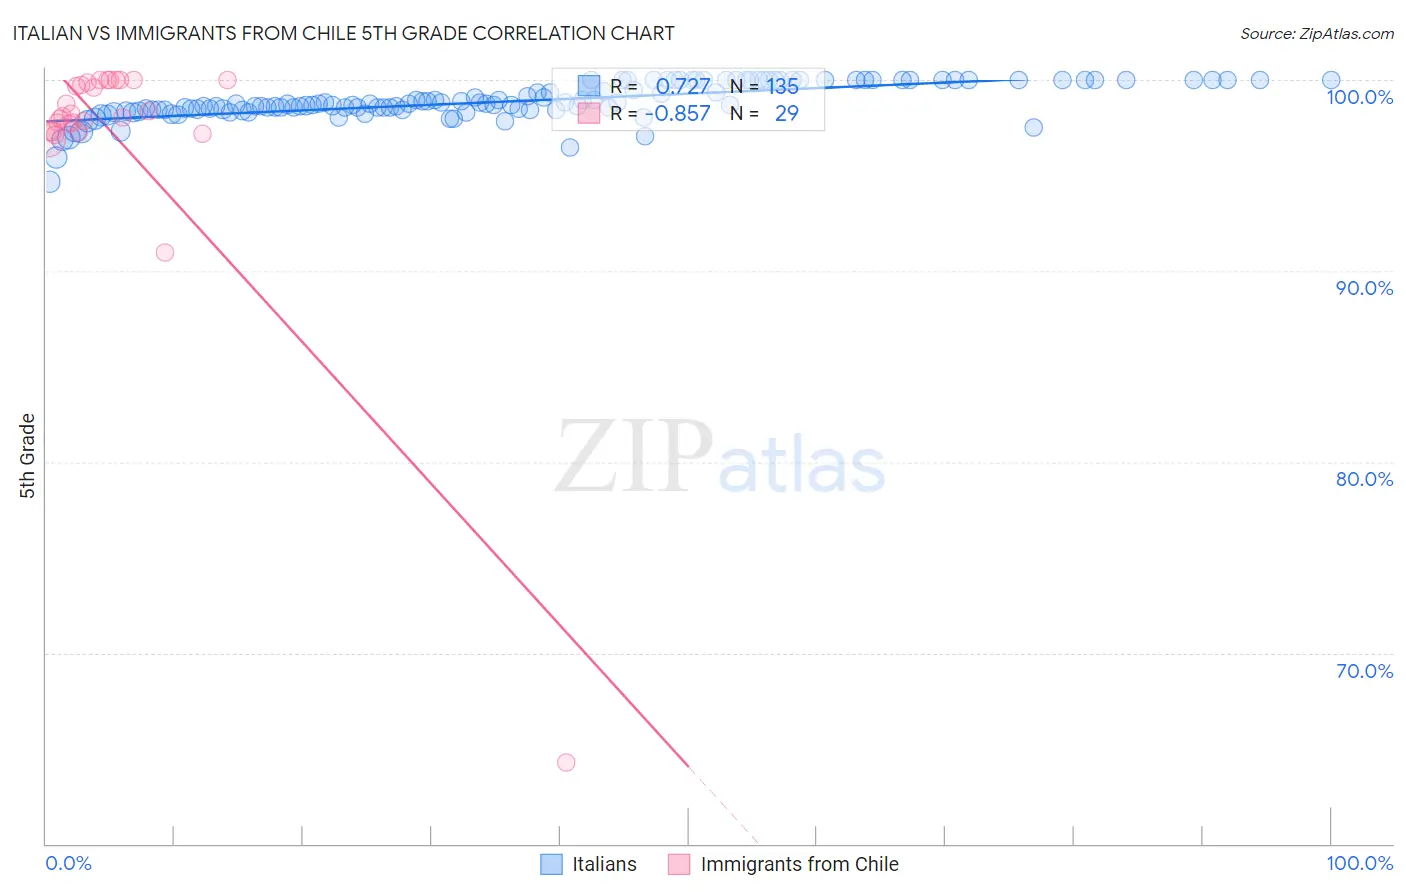
Italian vs Immigrants from Chile 5th Grade Correlation Chart

The statistical analysis conducted on geographies consisting of 575,115,824 people shows a strong positive correlation between the proportion of Italians and percentage of population with at least 5th grade education in the United States with a correlation coefficient (R) of 0.727 and weighted average of 98.1%. Similarly, the statistical analysis conducted on geographies consisting of 218,647,266 people shows a very strong negative correlation between the proportion of Immigrants from Chile and percentage of population with at least 5th grade education in the United States with a correlation coefficient (R) of -0.857 and weighted average of 97.2%, a difference of 0.98%.
Italian vs Immigrants from Chile 5th Grade

5th Grade Correlation Summary

MeasurementItalianImmigrants from Chile
Minimum94.7%64.3%
Maximum100.0%100.0%
Range5.3%35.7%
Mean98.9%97.2%
Median98.7%98.1%
Interquartile 25% (IQ1)98.4%97.3%
Interquartile 75% (IQ3)100.0%99.9%
Interquartile Range (IQR)1.6%2.6%
Standard Deviation (Sample)0.94%6.6%
Standard Deviation (Population)0.94%6.5%

Similar Demographics by 5th Grade

Demographics Similar to Italians by 5th Grade

In terms of 5th grade, the demographic groups most similar to Italians are Swiss (98.1%, a difference of 0.010%), Chinese (98.1%, a difference of 0.010%), British (98.1%, a difference of 0.010%), Chippewa (98.1%, a difference of 0.020%), and Latvian (98.1%, a difference of 0.030%).
DemographicsRating | Rank5th Grade
Czechs
100.0
/100
|
#28
Exceptional
98.2%
Scandinavians
100.0
/100
|
#29
Exceptional
98.2%
French Canadians
100.0
/100
|
#30
Exceptional
98.2%
Europeans
100.0
/100
|
#31
Exceptional
98.2%
Chippewa
100.0
/100
|
#32
Exceptional
98.1%
Swiss
100.0
/100
|
#33
Exceptional
98.1%
Chinese
100.0
/100
|
#34
Exceptional
98.1%
Italians
100.0
/100
|
#35
Exceptional
98.1%
British
100.0
/100
|
#36
Exceptional
98.1%
Latvians
99.9
/100
|
#37
Exceptional
98.1%
Belgians
99.9
/100
|
#38
Exceptional
98.1%
Luxembourgers
99.9
/100
|
#39
Exceptional
98.1%
Eastern Europeans
99.9
/100
|
#40
Exceptional
98.1%
Hungarians
99.9
/100
|
#41
Exceptional
98.0%
Northern Europeans
99.9
/100
|
#42
Exceptional
98.0%

Demographics Similar to Immigrants from Chile by 5th Grade

In terms of 5th grade, the demographic groups most similar to Immigrants from Chile are Immigrants from Northern Africa (97.2%, a difference of 0.0%), Native/Alaskan (97.2%, a difference of 0.010%), African (97.2%, a difference of 0.010%), Immigrants from Bahamas (97.2%, a difference of 0.010%), and Immigrants from Zaire (97.1%, a difference of 0.020%).
DemographicsRating | Rank5th Grade
Immigrants | Albania
28.5
/100
|
#194
Fair
97.2%
Guamanians/Chamorros
26.8
/100
|
#195
Fair
97.2%
Hawaiians
25.6
/100
|
#196
Fair
97.2%
Brazilians
25.4
/100
|
#197
Fair
97.2%
Immigrants | Uganda
21.1
/100
|
#198
Fair
97.2%
Natives/Alaskans
18.0
/100
|
#199
Poor
97.2%
Immigrants | Northern Africa
16.8
/100
|
#200
Poor
97.2%
Immigrants | Chile
16.6
/100
|
#201
Poor
97.2%
Africans
15.3
/100
|
#202
Poor
97.2%
Immigrants | Bahamas
14.9
/100
|
#203
Poor
97.2%
Immigrants | Zaire
13.7
/100
|
#204
Poor
97.1%
Moroccans
12.0
/100
|
#205
Poor
97.1%
Paiute
11.6
/100
|
#206
Poor
97.1%
Iraqis
10.9
/100
|
#207
Poor
97.1%
Laotians
10.8
/100
|
#208
Poor
97.1%