Italian vs Immigrants from Iraq Professional Degree
COMPARE
Italian
Immigrants from Iraq
Professional Degree
Professional Degree Comparison
Italians
Immigrants from Iraq
4.8%
PROFESSIONAL DEGREE
90.2/ 100
METRIC RATING
133rd/ 347
METRIC RANK
4.2%
PROFESSIONAL DEGREE
17.1/ 100
METRIC RATING
202nd/ 347
METRIC RANK
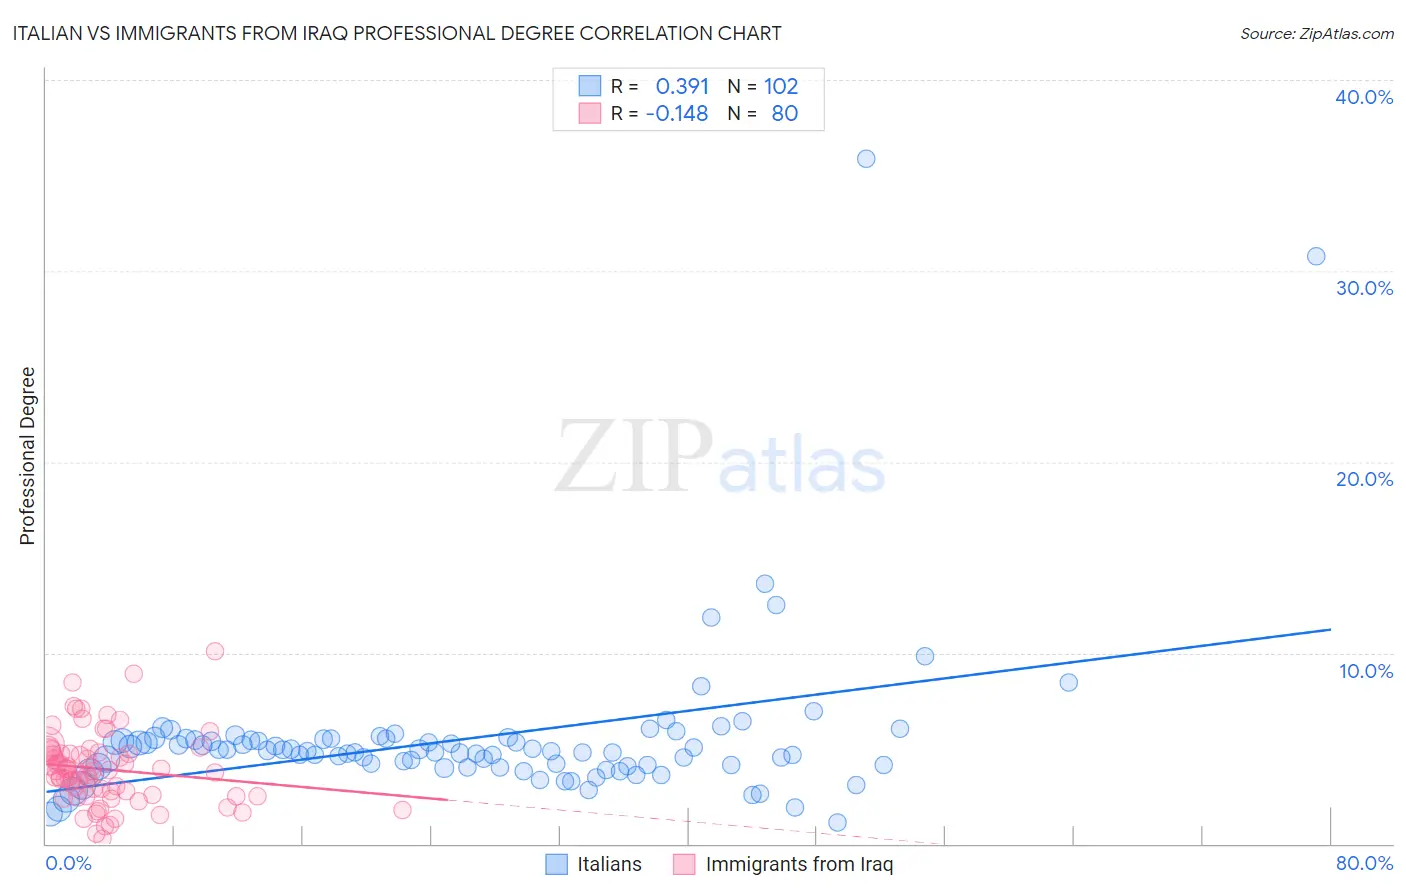
Italian vs Immigrants from Iraq Professional Degree Correlation Chart
The statistical analysis conducted on geographies consisting of 566,305,731 people shows a mild positive correlation between the proportion of Italians and percentage of population with at least professional degree education in the United States with a correlation coefficient (R) of 0.391 and weighted average of 4.8%. Similarly, the statistical analysis conducted on geographies consisting of 194,678,342 people shows a poor negative correlation between the proportion of Immigrants from Iraq and percentage of population with at least professional degree education in the United States with a correlation coefficient (R) of -0.148 and weighted average of 4.2%, a difference of 14.6%.
Professional Degree Correlation Summary
| Measurement | Italian | Immigrants from Iraq |
| Minimum | 1.1% | 0.28% |
| Maximum | 35.9% | 10.1% |
| Range | 34.7% | 9.8% |
| Mean | 5.5% | 3.9% |
| Median | 4.9% | 3.8% |
| Interquartile 25% (IQ1) | 4.1% | 2.5% |
| Interquartile 75% (IQ3) | 5.5% | 4.8% |
| Interquartile Range (IQR) | 1.4% | 2.2% |
| Standard Deviation (Sample) | 4.4% | 1.9% |
| Standard Deviation (Population) | 4.4% | 1.9% |
Similar Demographics by Professional Degree
Demographics Similar to Italians by Professional Degree
In terms of professional degree, the demographic groups most similar to Italians are South American Indian (4.8%, a difference of 0.12%), Macedonian (4.8%, a difference of 0.16%), Pakistani (4.8%, a difference of 0.25%), Immigrants from Jordan (4.7%, a difference of 0.44%), and Jordanian (4.7%, a difference of 0.46%).
| Demographics | Rating | Rank | Professional Degree |
| Europeans | 93.2 /100 | #126 | Exceptional 4.8% |
| Serbians | 92.6 /100 | #127 | Exceptional 4.8% |
| Immigrants | Eastern Africa | 92.5 /100 | #128 | Exceptional 4.8% |
| Palestinians | 91.5 /100 | #129 | Exceptional 4.8% |
| Icelanders | 91.5 /100 | #130 | Exceptional 4.8% |
| Immigrants | Nepal | 91.4 /100 | #131 | Exceptional 4.8% |
| Pakistanis | 90.9 /100 | #132 | Exceptional 4.8% |
| Italians | 90.2 /100 | #133 | Exceptional 4.8% |
| South American Indians | 89.9 /100 | #134 | Excellent 4.8% |
| Macedonians | 89.8 /100 | #135 | Excellent 4.8% |
| Immigrants | Jordan | 89.0 /100 | #136 | Excellent 4.7% |
| Jordanians | 88.9 /100 | #137 | Excellent 4.7% |
| Afghans | 88.8 /100 | #138 | Excellent 4.7% |
| South Americans | 85.6 /100 | #139 | Excellent 4.7% |
| Canadians | 84.4 /100 | #140 | Excellent 4.7% |
Demographics Similar to Immigrants from Iraq by Professional Degree
In terms of professional degree, the demographic groups most similar to Immigrants from Iraq are Panamanian (4.1%, a difference of 0.33%), Barbadian (4.1%, a difference of 0.36%), Finnish (4.2%, a difference of 0.43%), Somali (4.1%, a difference of 0.68%), and Immigrants from North Macedonia (4.2%, a difference of 0.79%).
| Demographics | Rating | Rank | Professional Degree |
| Nigerians | 24.6 /100 | #195 | Fair 4.2% |
| Spanish | 23.0 /100 | #196 | Fair 4.2% |
| Czechoslovakians | 22.4 /100 | #197 | Fair 4.2% |
| Immigrants | Middle Africa | 22.1 /100 | #198 | Fair 4.2% |
| Norwegians | 20.5 /100 | #199 | Fair 4.2% |
| Immigrants | North Macedonia | 20.2 /100 | #200 | Fair 4.2% |
| Finns | 18.7 /100 | #201 | Poor 4.2% |
| Immigrants | Iraq | 17.1 /100 | #202 | Poor 4.2% |
| Panamanians | 15.9 /100 | #203 | Poor 4.1% |
| Barbadians | 15.8 /100 | #204 | Poor 4.1% |
| Somalis | 14.8 /100 | #205 | Poor 4.1% |
| Yugoslavians | 13.4 /100 | #206 | Poor 4.1% |
| Sub-Saharan Africans | 12.8 /100 | #207 | Poor 4.1% |
| Immigrants | Somalia | 12.5 /100 | #208 | Poor 4.1% |
| Immigrants | Panama | 12.3 /100 | #209 | Poor 4.1% |