Israeli vs Central American 2nd Grade
COMPARE
Israeli
Central American
2nd Grade
2nd Grade Comparison
Israelis
Central Americans
98.0%
2ND GRADE
87.9/ 100
METRIC RATING
138th/ 347
METRIC RANK
96.4%
2ND GRADE
0.0/ 100
METRIC RATING
334th/ 347
METRIC RANK
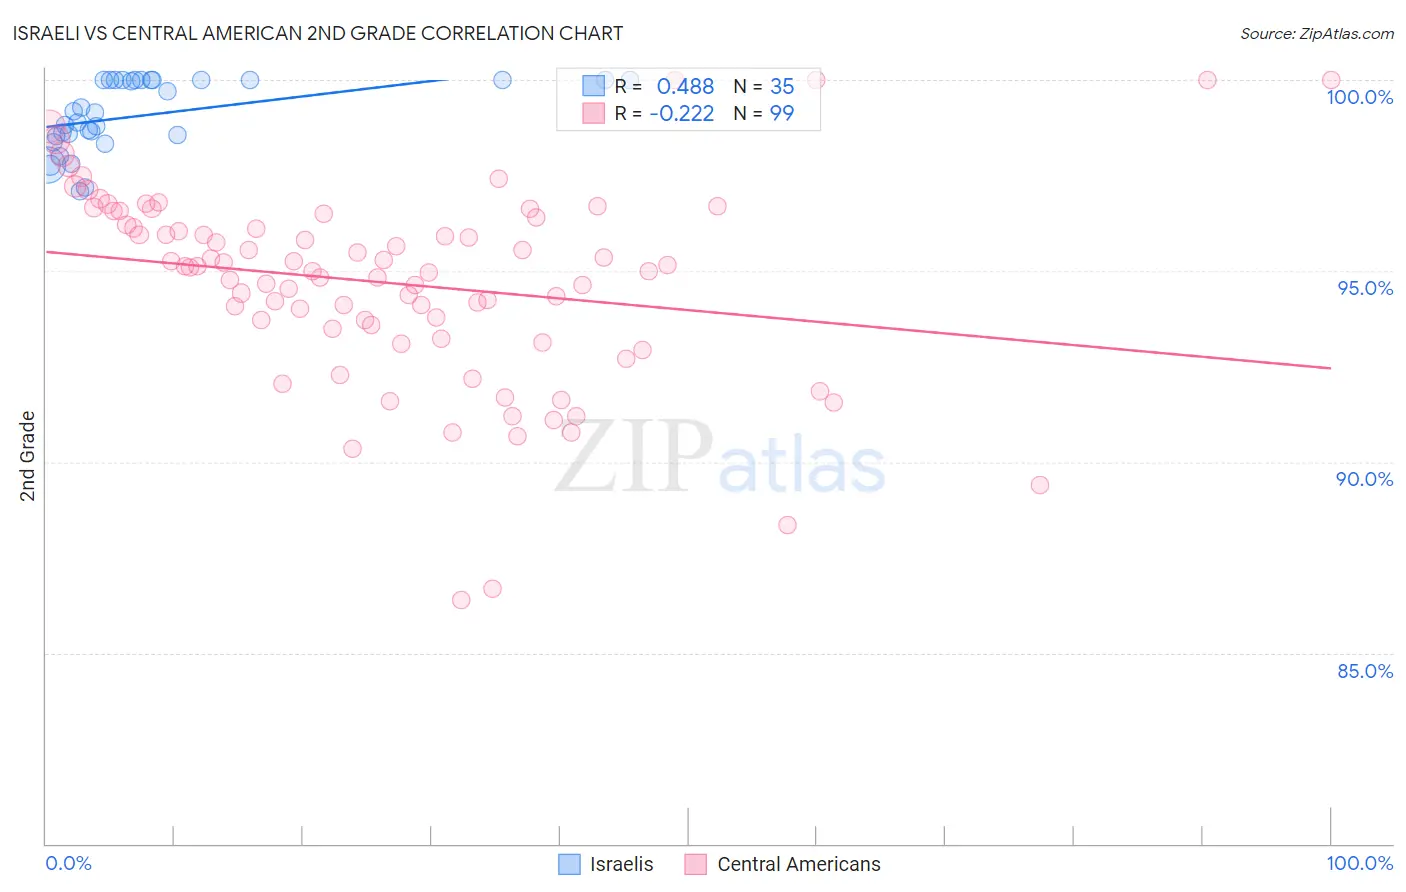
Israeli vs Central American 2nd Grade Correlation Chart
The statistical analysis conducted on geographies consisting of 211,219,690 people shows a moderate positive correlation between the proportion of Israelis and percentage of population with at least 2nd grade education in the United States with a correlation coefficient (R) of 0.488 and weighted average of 98.0%. Similarly, the statistical analysis conducted on geographies consisting of 504,619,275 people shows a weak negative correlation between the proportion of Central Americans and percentage of population with at least 2nd grade education in the United States with a correlation coefficient (R) of -0.222 and weighted average of 96.4%, a difference of 1.7%.
2nd Grade Correlation Summary
| Measurement | Israeli | Central American |
| Minimum | 97.1% | 86.4% |
| Maximum | 100.0% | 100.0% |
| Range | 2.9% | 13.6% |
| Mean | 99.1% | 94.7% |
| Median | 99.2% | 95.1% |
| Interquartile 25% (IQ1) | 98.5% | 93.5% |
| Interquartile 75% (IQ3) | 100.0% | 96.4% |
| Interquartile Range (IQR) | 1.5% | 2.9% |
| Standard Deviation (Sample) | 0.92% | 2.6% |
| Standard Deviation (Population) | 0.90% | 2.6% |
Similar Demographics by 2nd Grade
Demographics Similar to Israelis by 2nd Grade
In terms of 2nd grade, the demographic groups most similar to Israelis are Immigrants from Romania (98.0%, a difference of 0.0%), Blackfeet (98.0%, a difference of 0.0%), Immigrants from Hungary (98.0%, a difference of 0.010%), Immigrants from Bulgaria (98.0%, a difference of 0.010%), and Immigrants from Kuwait (98.0%, a difference of 0.010%).
| Demographics | Rating | Rank | 2nd Grade |
| Immigrants | Europe | 91.1 /100 | #131 | Exceptional 98.0% |
| Spaniards | 90.7 /100 | #132 | Exceptional 98.0% |
| Cambodians | 90.7 /100 | #133 | Exceptional 98.0% |
| Immigrants | Hungary | 89.7 /100 | #134 | Excellent 98.0% |
| Immigrants | Bulgaria | 89.7 /100 | #135 | Excellent 98.0% |
| Immigrants | Kuwait | 89.2 /100 | #136 | Excellent 98.0% |
| Immigrants | Romania | 88.3 /100 | #137 | Excellent 98.0% |
| Israelis | 87.9 /100 | #138 | Excellent 98.0% |
| Blackfeet | 87.5 /100 | #139 | Excellent 98.0% |
| Palestinians | 83.9 /100 | #140 | Excellent 98.0% |
| Immigrants | Turkey | 83.0 /100 | #141 | Excellent 98.0% |
| Burmese | 81.0 /100 | #142 | Excellent 98.0% |
| Alsatians | 80.5 /100 | #143 | Excellent 98.0% |
| Hmong | 80.0 /100 | #144 | Good 98.0% |
| Filipinos | 79.2 /100 | #145 | Good 98.0% |
Demographics Similar to Central Americans by 2nd Grade
In terms of 2nd grade, the demographic groups most similar to Central Americans are Yakama (96.4%, a difference of 0.010%), Immigrants from Dominican Republic (96.4%, a difference of 0.020%), Immigrants from Fiji (96.4%, a difference of 0.020%), Immigrants from Cambodia (96.4%, a difference of 0.030%), and Immigrants from Cabo Verde (96.3%, a difference of 0.050%).
| Demographics | Rating | Rank | 2nd Grade |
| Immigrants | Vietnam | 0.0 /100 | #327 | Tragic 96.5% |
| Mexicans | 0.0 /100 | #328 | Tragic 96.5% |
| Japanese | 0.0 /100 | #329 | Tragic 96.5% |
| Immigrants | Latin America | 0.0 /100 | #330 | Tragic 96.5% |
| Immigrants | Armenia | 0.0 /100 | #331 | Tragic 96.5% |
| Bangladeshis | 0.0 /100 | #332 | Tragic 96.5% |
| Immigrants | Dominican Republic | 0.0 /100 | #333 | Tragic 96.4% |
| Central Americans | 0.0 /100 | #334 | Tragic 96.4% |
| Yakama | 0.0 /100 | #335 | Tragic 96.4% |
| Immigrants | Fiji | 0.0 /100 | #336 | Tragic 96.4% |
| Immigrants | Cambodia | 0.0 /100 | #337 | Tragic 96.4% |
| Immigrants | Cabo Verde | 0.0 /100 | #338 | Tragic 96.3% |
| Guatemalans | 0.0 /100 | #339 | Tragic 96.3% |
| Immigrants | Guatemala | 0.0 /100 | #340 | Tragic 96.2% |
| Immigrants | Central America | 0.0 /100 | #341 | Tragic 96.2% |