Immigrants from El Salvador vs Immigrants from England 7th Grade
COMPARE
Immigrants from El Salvador
Immigrants from England
7th Grade
7th Grade Comparison
Immigrants from El Salvador
Immigrants from England
90.9%
7TH GRADE
0.0/ 100
METRIC RATING
345th/ 347
METRIC RANK
96.8%
7TH GRADE
99.5/ 100
METRIC RATING
74th/ 347
METRIC RANK
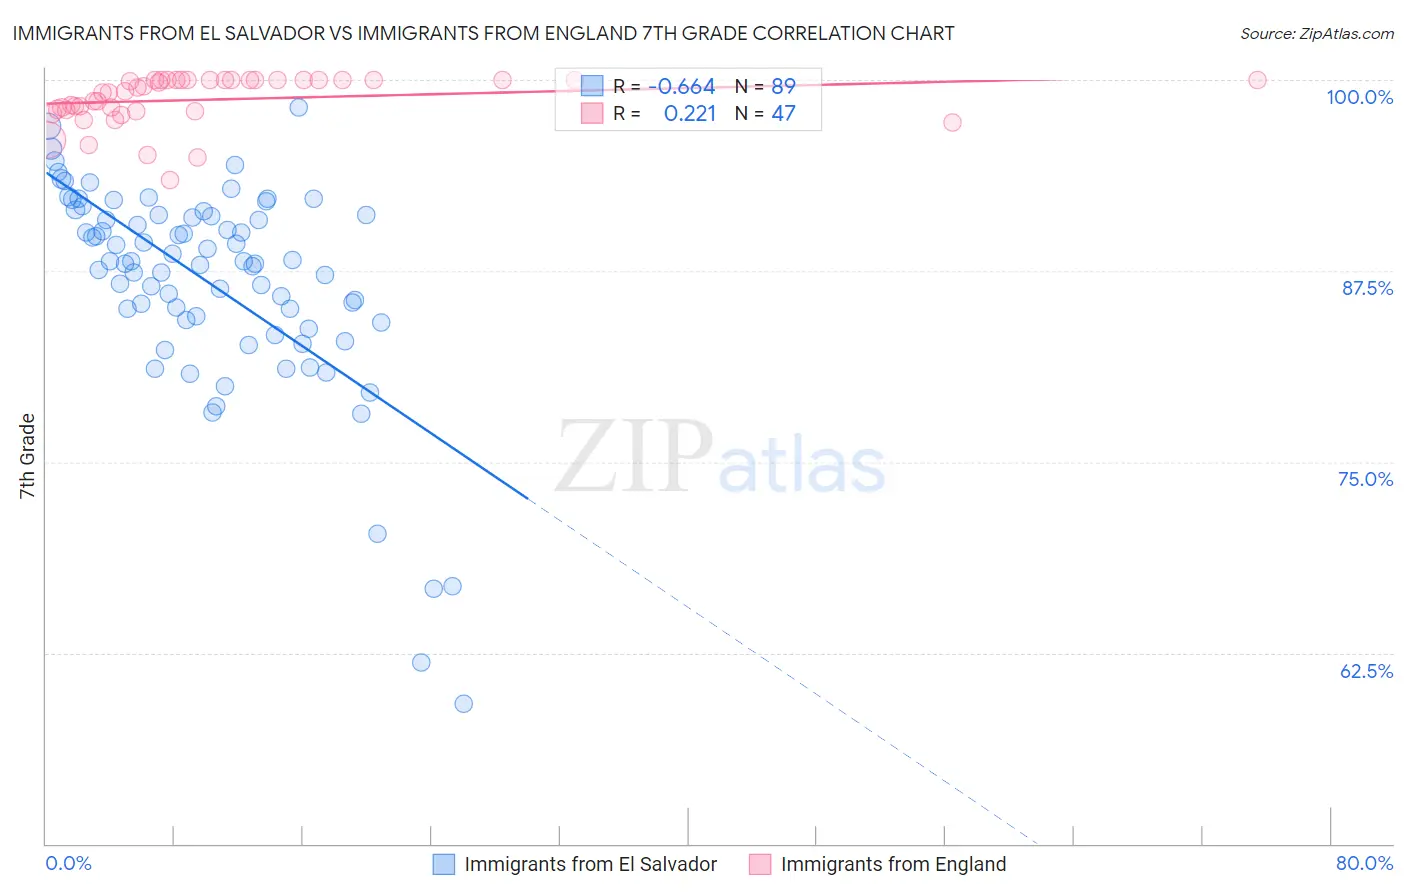
Immigrants from El Salvador vs Immigrants from England 7th Grade Correlation Chart
The statistical analysis conducted on geographies consisting of 357,828,194 people shows a significant negative correlation between the proportion of Immigrants from El Salvador and percentage of population with at least 7th grade education in the United States with a correlation coefficient (R) of -0.664 and weighted average of 90.9%. Similarly, the statistical analysis conducted on geographies consisting of 391,898,018 people shows a weak positive correlation between the proportion of Immigrants from England and percentage of population with at least 7th grade education in the United States with a correlation coefficient (R) of 0.221 and weighted average of 96.8%, a difference of 6.5%.
7th Grade Correlation Summary
| Measurement | Immigrants from El Salvador | Immigrants from England |
| Minimum | 59.1% | 93.4% |
| Maximum | 98.2% | 100.0% |
| Range | 39.1% | 6.6% |
| Mean | 86.7% | 98.7% |
| Median | 88.1% | 99.3% |
| Interquartile 25% (IQ1) | 84.2% | 98.0% |
| Interquartile 75% (IQ3) | 91.1% | 100.0% |
| Interquartile Range (IQR) | 6.9% | 2.0% |
| Standard Deviation (Sample) | 7.0% | 1.6% |
| Standard Deviation (Population) | 6.9% | 1.6% |
Similar Demographics by 7th Grade
Demographics Similar to Immigrants from El Salvador by 7th Grade
In terms of 7th grade, the demographic groups most similar to Immigrants from El Salvador are Immigrants from Central America (91.0%, a difference of 0.060%), Immigrants from Mexico (90.7%, a difference of 0.20%), Immigrants from Guatemala (91.3%, a difference of 0.43%), Salvadoran (91.5%, a difference of 0.59%), and Spanish American Indian (90.3%, a difference of 0.68%).
| Demographics | Rating | Rank | 7th Grade |
| Immigrants | Armenia | 0.0 /100 | #333 | Tragic 92.7% |
| Immigrants | Yemen | 0.0 /100 | #334 | Tragic 92.6% |
| Mexican American Indians | 0.0 /100 | #335 | Tragic 92.6% |
| Immigrants | Honduras | 0.0 /100 | #336 | Tragic 92.5% |
| Immigrants | Latin America | 0.0 /100 | #337 | Tragic 92.2% |
| Central Americans | 0.0 /100 | #338 | Tragic 92.1% |
| Mexicans | 0.0 /100 | #339 | Tragic 91.9% |
| Yakama | 0.0 /100 | #340 | Tragic 91.7% |
| Guatemalans | 0.0 /100 | #341 | Tragic 91.7% |
| Salvadorans | 0.0 /100 | #342 | Tragic 91.5% |
| Immigrants | Guatemala | 0.0 /100 | #343 | Tragic 91.3% |
| Immigrants | Central America | 0.0 /100 | #344 | Tragic 91.0% |
| Immigrants | El Salvador | 0.0 /100 | #345 | Tragic 90.9% |
| Immigrants | Mexico | 0.0 /100 | #346 | Tragic 90.7% |
| Spanish American Indians | 0.0 /100 | #347 | Tragic 90.3% |
Demographics Similar to Immigrants from England by 7th Grade
In terms of 7th grade, the demographic groups most similar to Immigrants from England are Zimbabwean (96.8%, a difference of 0.0%), Arapaho (96.8%, a difference of 0.010%), Immigrants from Lithuania (96.8%, a difference of 0.030%), Cajun (96.8%, a difference of 0.030%), and Immigrants from Ireland (96.8%, a difference of 0.030%).
| Demographics | Rating | Rank | 7th Grade |
| Native Hawaiians | 99.7 /100 | #67 | Exceptional 96.9% |
| Immigrants | India | 99.6 /100 | #68 | Exceptional 96.9% |
| Iranians | 99.6 /100 | #69 | Exceptional 96.8% |
| New Zealanders | 99.6 /100 | #70 | Exceptional 96.8% |
| Immigrants | Lithuania | 99.6 /100 | #71 | Exceptional 96.8% |
| Cajuns | 99.5 /100 | #72 | Exceptional 96.8% |
| Arapaho | 99.5 /100 | #73 | Exceptional 96.8% |
| Immigrants | England | 99.5 /100 | #74 | Exceptional 96.8% |
| Zimbabweans | 99.5 /100 | #75 | Exceptional 96.8% |
| Immigrants | Ireland | 99.4 /100 | #76 | Exceptional 96.8% |
| Cherokee | 99.4 /100 | #77 | Exceptional 96.8% |
| Immigrants | Netherlands | 99.3 /100 | #78 | Exceptional 96.8% |
| Cypriots | 99.3 /100 | #79 | Exceptional 96.8% |
| Yugoslavians | 99.3 /100 | #80 | Exceptional 96.8% |
| Delaware | 99.2 /100 | #81 | Exceptional 96.8% |