Immigrants from Serbia vs Immigrants from Croatia 12th Grade, No Diploma

COMPARE

Immigrants from Serbia
Race
Ancestry
AfghanAfricanAlaska NativeAlaskan AthabascanAlbanianAleutAlsatianAmericanApacheArabArapahoArgentineanArmenianAssyrian/Chaldean/SyriacAustralianAustrianBahamianBangladeshiBarbadianBasqueBelgianBelizeanBermudanBhutaneseBlackfeetBolivianBrazilianBritishBritish West IndianBulgarianBurmeseCajunCambodianCanadianCape VerdeanCarpatho RusynCelticCentral AmericanCentral American IndianCherokeeCheyenneChickasawChileanChineseChippewaChoctawColombianColvilleComancheCosta RicanCreeCreekCroatianCrowCubanCypriotCzechCzechoslovakianDanishDelawareDominicanDutchDutch West IndianEastern EuropeanEcuadorianEgyptianEnglishEstonianEthiopianEuropeanFijianFilipinoFinnishFrenchFrench American IndianFrench CanadianGermanGerman RussianGhanaianGreekGuamanian/ChamorroGuatemalanGuyaneseHaitianHmongHonduranHopiHoumaHungarianIcelanderIndian (Asian)IndonesianInupiatIranianIraqiIrishIroquoisIsraeliItalianJamaicanJapaneseJordanianKenyanKiowaKoreanLaotianLatvianLebaneseLiberianLithuanianLumbeeLuxembourgerMacedonianMalaysianMalteseMarshalleseMenomineeMexicanMexican American IndianMongolianMoroccanNative HawaiianNavajoNepaleseNew ZealanderNicaraguanNigerianNorthern EuropeanNorwegianOkinawanOsageOttawaPaiutePakistaniPalestinianPanamanianParaguayanPennsylvania GermanPeruvianPimaPolishPortuguesePotawatomiPuebloPuerto RicanPuget Sound SalishRomanianRussianSalvadoranSamoanScandinavianScotch-IrishScottishSeminoleSenegaleseSerbianShoshoneSierra LeoneanSiouxSlavicSlovakSloveneSomaliSouth AfricanSouth AmericanSouth American IndianSoviet UnionSpaniardSpanishSpanish AmericanSpanish American IndianSri LankanSubsaharan AfricanSudaneseSwedishSwissSyrianTaiwaneseThaiTlingit-HaidaTohono O'OdhamTonganTrinidadian and TobagonianTsimshianTurkishU.S. Virgin IslanderUgandanUkrainianUruguayanUteVenezuelanVietnameseWelshWest IndianYakamaYaquiYugoslavianYumanYup'ikZimbabwean
Immigration
NonimmigrantsImmigrantsAfghanistanAfricaAlbaniaArgentinaArmeniaAsiaAustraliaAustriaBahamasBangladeshBarbadosBelarusBelgiumBelizeBoliviaBosnia and HerzegovinaBrazilBulgariaBurma/MyanmarCabo VerdeCambodiaCameroonCanadaCaribbeanCentral AmericaChileChinaColombiaCongoCosta RicaCubaCzechoslovakiaDenmarkDominicaDominican RepublicEastern AfricaEastern AsiaEastern EuropeEcuadorEgyptEl SalvadorEnglandEritreaEthiopiaEuropeFijiFranceGermanyGhanaGreeceGrenadaGuatemalaGuyanaHaitiHondurasHong KongHungaryIndiaIndonesiaIranIraqIrelandIsraelItalyJamaicaJapanJordanKazakhstanKenyaKoreaKuwaitLaosLatin AmericaLatviaLebanonLiberiaLithuaniaMalaysiaMexicoMicronesiaMiddle AfricaMoldovaMoroccoNepalNetherlandsNicaraguaNigeriaNorth AmericaNorth MacedoniaNorthern AfricaNorthern EuropeNorwayOceaniaPakistanPanamaPeruPhilippinesPolandPortugalRomaniaRussiaSaudi ArabiaScotlandSenegalSerbiaSierra LeoneSingaporeSomaliaSouth AfricaSouth AmericaSouth Central AsiaSouth Eastern AsiaSouthern EuropeSpainSri LankaSt. Vincent and the GrenadinesSudanSwedenSwitzerlandSyriaTaiwanThailandTrinidad and TobagoTurkeyUgandaUkraineUruguayUzbekistanVenezuelaVietnamWest IndiesWestern AfricaWestern AsiaWestern EuropeYemenZaireZimbabweAzores
Immigrants from Croatia
Race
Ancestry
AfghanAfricanAlaska NativeAlaskan AthabascanAlbanianAleutAlsatianAmericanApacheArabArapahoArgentineanArmenianAssyrian/Chaldean/SyriacAustralianAustrianBahamianBangladeshiBarbadianBasqueBelgianBelizeanBermudanBhutaneseBlackfeetBolivianBrazilianBritishBritish West IndianBulgarianBurmeseCajunCambodianCanadianCape VerdeanCarpatho RusynCelticCentral AmericanCentral American IndianCherokeeCheyenneChickasawChileanChineseChippewaChoctawColombianColvilleComancheCosta RicanCreeCreekCroatianCrowCubanCypriotCzechCzechoslovakianDanishDelawareDominicanDutchDutch West IndianEastern EuropeanEcuadorianEgyptianEnglishEstonianEthiopianEuropeanFijianFilipinoFinnishFrenchFrench American IndianFrench CanadianGermanGerman RussianGhanaianGreekGuamanian/ChamorroGuatemalanGuyaneseHaitianHmongHonduranHopiHoumaHungarianIcelanderIndian (Asian)IndonesianInupiatIranianIraqiIrishIroquoisIsraeliItalianJamaicanJapaneseJordanianKenyanKiowaKoreanLaotianLatvianLebaneseLiberianLithuanianLumbeeLuxembourgerMacedonianMalaysianMalteseMarshalleseMenomineeMexicanMexican American IndianMongolianMoroccanNative HawaiianNavajoNepaleseNew ZealanderNicaraguanNigerianNorthern EuropeanNorwegianOkinawanOsageOttawaPaiutePakistaniPalestinianPanamanianParaguayanPennsylvania GermanPeruvianPimaPolishPortuguesePotawatomiPuebloPuerto RicanPuget Sound SalishRomanianRussianSalvadoranSamoanScandinavianScotch-IrishScottishSeminoleSenegaleseSerbianShoshoneSierra LeoneanSiouxSlavicSlovakSloveneSomaliSouth AfricanSouth AmericanSouth American IndianSoviet UnionSpaniardSpanishSpanish AmericanSpanish American IndianSri LankanSubsaharan AfricanSudaneseSwedishSwissSyrianTaiwaneseThaiTlingit-HaidaTohono O'OdhamTonganTrinidadian and TobagonianTsimshianTurkishU.S. Virgin IslanderUgandanUkrainianUruguayanUteVenezuelanVietnameseWelshWest IndianYakamaYaquiYugoslavianYumanYup'ikZimbabwean
Immigration
NonimmigrantsImmigrantsAfghanistanAfricaAlbaniaArgentinaArmeniaAsiaAustraliaAustriaBahamasBangladeshBarbadosBelarusBelgiumBelizeBoliviaBosnia and HerzegovinaBrazilBulgariaBurma/MyanmarCabo VerdeCambodiaCameroonCanadaCaribbeanCentral AmericaChileChinaColombiaCongoCosta RicaCroatiaCubaCzechoslovakiaDenmarkDominicaDominican RepublicEastern AfricaEastern AsiaEastern EuropeEcuadorEgyptEl SalvadorEnglandEritreaEthiopiaEuropeFijiFranceGermanyGhanaGreeceGrenadaGuatemalaGuyanaHaitiHondurasHong KongHungaryIndiaIndonesiaIranIraqIrelandIsraelItalyJamaicaJapanJordanKazakhstanKenyaKoreaKuwaitLaosLatin AmericaLatviaLebanonLiberiaLithuaniaMalaysiaMexicoMicronesiaMiddle AfricaMoldovaMoroccoNepalNetherlandsNicaraguaNigeriaNorth AmericaNorth MacedoniaNorthern AfricaNorthern EuropeNorwayOceaniaPakistanPanamaPeruPhilippinesPolandPortugalRomaniaRussiaSaudi ArabiaScotlandSenegalSierra LeoneSingaporeSomaliaSouth AfricaSouth AmericaSouth Central AsiaSouth Eastern AsiaSouthern EuropeSpainSri LankaSt. Vincent and the GrenadinesSudanSwedenSwitzerlandSyriaTaiwanThailandTrinidad and TobagoTurkeyUgandaUkraineUruguayUzbekistanVenezuelaVietnamWest IndiesWestern AfricaWestern AsiaWestern EuropeYemenZaireZimbabweAzores
12th Grade, No Diploma
Income
Poverty
Unemployment
Labor Participation
Family Structure
Vehicle Availability
Education Level
Disability

12th Grade, No Diploma Comparison

Immigrants from Serbia

Immigrants from Croatia

Exceptional
Exceptional
92.4%
12TH GRADE, NO DIPLOMA
98.6/ 100
METRIC RATING
90th/ 347
METRIC RANK
92.3%
12TH GRADE, NO DIPLOMA
98.3/ 100
METRIC RATING
100th/ 347
METRIC RANK

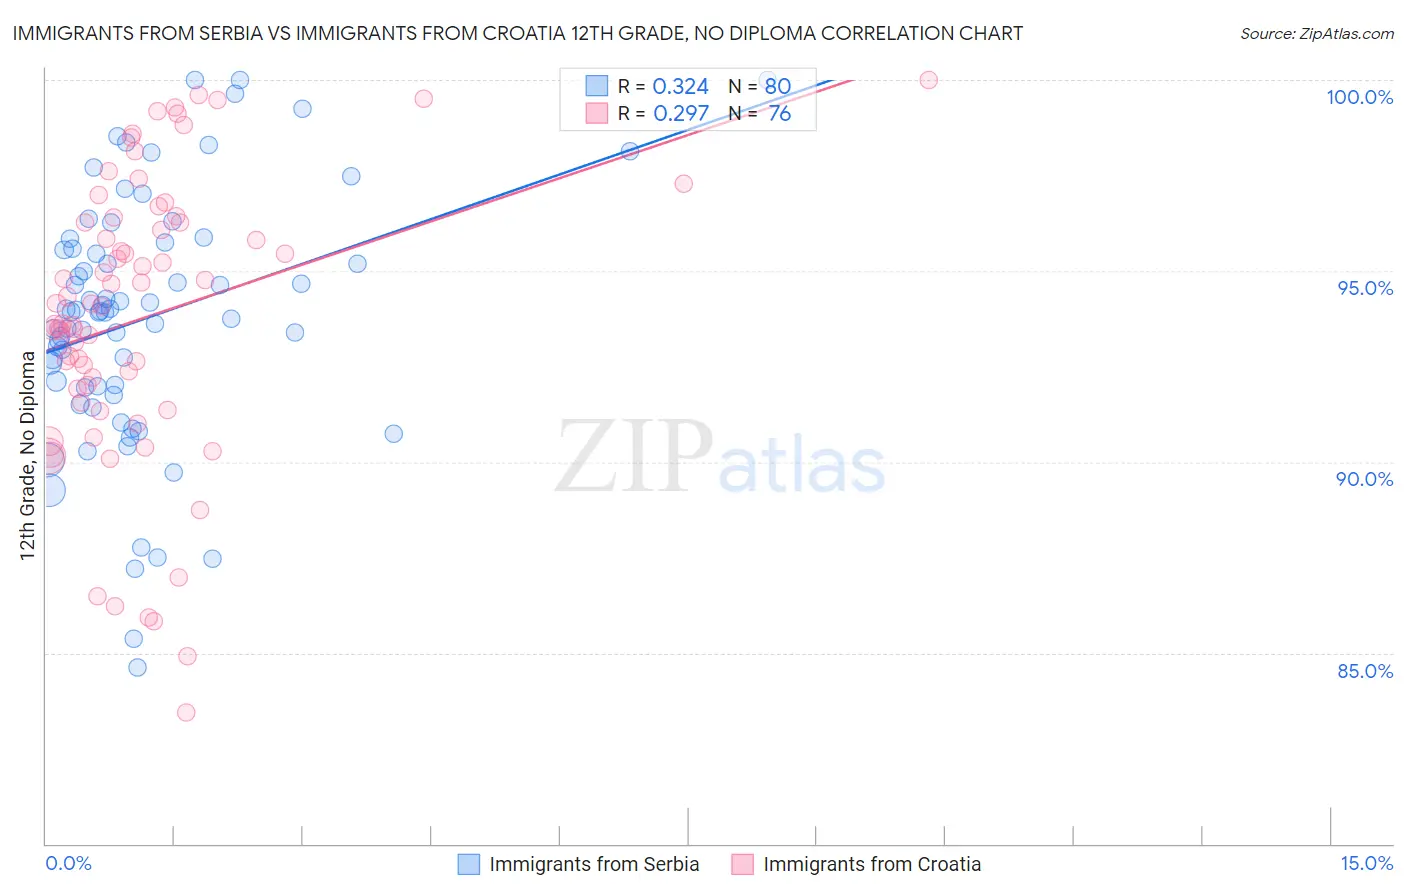
Immigrants from Serbia vs Immigrants from Croatia 12th Grade, No Diploma Correlation Chart

The statistical analysis conducted on geographies consisting of 131,745,658 people shows a mild positive correlation between the proportion of Immigrants from Serbia and percentage of population with at least 12th grade (no diploma) education in the United States with a correlation coefficient (R) of 0.324 and weighted average of 92.4%. Similarly, the statistical analysis conducted on geographies consisting of 132,548,119 people shows a weak positive correlation between the proportion of Immigrants from Croatia and percentage of population with at least 12th grade (no diploma) education in the United States with a correlation coefficient (R) of 0.297 and weighted average of 92.3%, a difference of 0.070%.
Immigrants from Serbia vs Immigrants from Croatia 12th Grade, No Diploma

12th Grade, No Diploma Correlation Summary

MeasurementImmigrants from SerbiaImmigrants from Croatia
Minimum84.6%83.4%
Maximum100.0%100.0%
Range15.4%16.6%
Mean93.8%93.8%
Median93.9%94.1%
Interquartile 25% (IQ1)92.0%91.7%
Interquartile 75% (IQ3)95.7%96.3%
Interquartile Range (IQR)3.7%4.6%
Standard Deviation (Sample)3.3%3.8%
Standard Deviation (Population)3.3%3.7%

Demographics Similar to Immigrants from Serbia and Immigrants from Croatia by 12th Grade, No Diploma

In terms of 12th grade, no diploma, the demographic groups most similar to Immigrants from Serbia are Canadian (92.4%, a difference of 0.010%), South African (92.4%, a difference of 0.010%), Immigrants from Romania (92.3%, a difference of 0.020%), Immigrants from Western Europe (92.3%, a difference of 0.020%), and Immigrants from Europe (92.3%, a difference of 0.030%). Similarly, the demographic groups most similar to Immigrants from Croatia are Immigrants from Korea (92.3%, a difference of 0.010%), Celtic (92.3%, a difference of 0.020%), Immigrants from Kuwait (92.3%, a difference of 0.020%), Swiss (92.3%, a difference of 0.020%), and Icelander (92.3%, a difference of 0.030%).
DemographicsRating | Rank12th Grade, No Diploma
Immigrants | Saudi Arabia
99.0
/100
|
#85
Exceptional
92.5%
Immigrants | Turkey
98.9
/100
|
#86
Exceptional
92.4%
Immigrants | France
98.8
/100
|
#87
Exceptional
92.4%
Scotch-Irish
98.8
/100
|
#88
Exceptional
92.4%
Canadians
98.7
/100
|
#89
Exceptional
92.4%
Immigrants | Serbia
98.6
/100
|
#90
Exceptional
92.4%
South Africans
98.6
/100
|
#91
Exceptional
92.4%
Immigrants | Romania
98.5
/100
|
#92
Exceptional
92.3%
Immigrants | Western Europe
98.5
/100
|
#93
Exceptional
92.3%
Immigrants | Europe
98.5
/100
|
#94
Exceptional
92.3%
Immigrants | North Macedonia
98.5
/100
|
#95
Exceptional
92.3%
Icelanders
98.5
/100
|
#96
Exceptional
92.3%
Celtics
98.4
/100
|
#97
Exceptional
92.3%
Immigrants | Kuwait
98.4
/100
|
#98
Exceptional
92.3%
Immigrants | Korea
98.3
/100
|
#99
Exceptional
92.3%
Immigrants | Croatia
98.3
/100
|
#100
Exceptional
92.3%
Swiss
98.1
/100
|
#101
Exceptional
92.3%
Alaskan Athabascans
98.1
/100
|
#102
Exceptional
92.3%
Immigrants | Norway
98.1
/100
|
#103
Exceptional
92.3%
Lebanese
97.6
/100
|
#104
Exceptional
92.2%
Immigrants | Belarus
97.4
/100
|
#105
Exceptional
92.2%