Immigrants from Caribbean vs Immigrants from Croatia 12th Grade, No Diploma
COMPARE
Immigrants from Caribbean
Immigrants from Croatia
12th Grade, No Diploma
12th Grade, No Diploma Comparison
Immigrants from Caribbean
Immigrants from Croatia
87.4%
12TH GRADE, NO DIPLOMA
0.0/ 100
METRIC RATING
313th/ 347
METRIC RANK
92.3%
12TH GRADE, NO DIPLOMA
98.3/ 100
METRIC RATING
100th/ 347
METRIC RANK
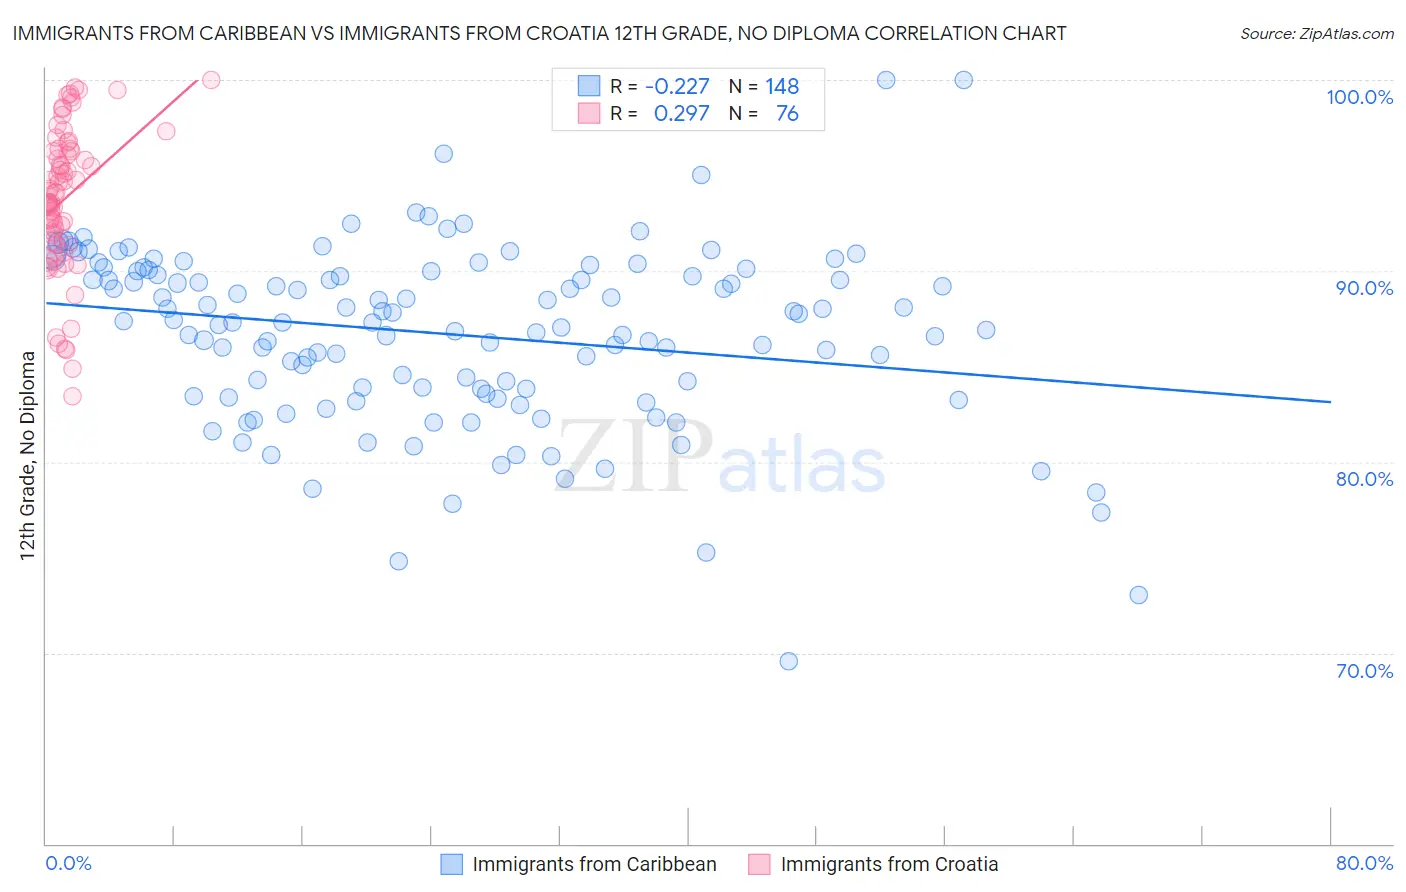
Immigrants from Caribbean vs Immigrants from Croatia 12th Grade, No Diploma Correlation Chart
The statistical analysis conducted on geographies consisting of 450,064,731 people shows a weak negative correlation between the proportion of Immigrants from Caribbean and percentage of population with at least 12th grade (no diploma) education in the United States with a correlation coefficient (R) of -0.227 and weighted average of 87.4%. Similarly, the statistical analysis conducted on geographies consisting of 132,548,119 people shows a weak positive correlation between the proportion of Immigrants from Croatia and percentage of population with at least 12th grade (no diploma) education in the United States with a correlation coefficient (R) of 0.297 and weighted average of 92.3%, a difference of 5.6%.
12th Grade, No Diploma Correlation Summary
| Measurement | Immigrants from Caribbean | Immigrants from Croatia |
| Minimum | 69.6% | 83.4% |
| Maximum | 100.0% | 100.0% |
| Range | 30.4% | 16.6% |
| Mean | 86.7% | 93.8% |
| Median | 87.3% | 94.1% |
| Interquartile 25% (IQ1) | 83.7% | 91.7% |
| Interquartile 75% (IQ3) | 90.0% | 96.3% |
| Interquartile Range (IQR) | 6.3% | 4.6% |
| Standard Deviation (Sample) | 4.7% | 3.8% |
| Standard Deviation (Population) | 4.7% | 3.7% |
Similar Demographics by 12th Grade, No Diploma
Demographics Similar to Immigrants from Caribbean by 12th Grade, No Diploma
In terms of 12th grade, no diploma, the demographic groups most similar to Immigrants from Caribbean are Cape Verdean (87.4%, a difference of 0.020%), Nicaraguan (87.3%, a difference of 0.050%), Apache (87.3%, a difference of 0.070%), Yaqui (87.5%, a difference of 0.12%), and Immigrants from Ecuador (87.5%, a difference of 0.12%).
| Demographics | Rating | Rank | 12th Grade, No Diploma |
| Natives/Alaskans | 0.0 /100 | #306 | Tragic 87.7% |
| Immigrants | Portugal | 0.0 /100 | #307 | Tragic 87.6% |
| Yup'ik | 0.0 /100 | #308 | Tragic 87.6% |
| Immigrants | Armenia | 0.0 /100 | #309 | Tragic 87.6% |
| Immigrants | Cuba | 0.0 /100 | #310 | Tragic 87.5% |
| Yaqui | 0.0 /100 | #311 | Tragic 87.5% |
| Immigrants | Ecuador | 0.0 /100 | #312 | Tragic 87.5% |
| Immigrants | Caribbean | 0.0 /100 | #313 | Tragic 87.4% |
| Cape Verdeans | 0.0 /100 | #314 | Tragic 87.4% |
| Nicaraguans | 0.0 /100 | #315 | Tragic 87.3% |
| Apache | 0.0 /100 | #316 | Tragic 87.3% |
| Navajo | 0.0 /100 | #317 | Tragic 87.1% |
| Belizeans | 0.0 /100 | #318 | Tragic 87.0% |
| Immigrants | Belize | 0.0 /100 | #319 | Tragic 87.0% |
| Immigrants | Nicaragua | 0.0 /100 | #320 | Tragic 86.6% |
Demographics Similar to Immigrants from Croatia by 12th Grade, No Diploma
In terms of 12th grade, no diploma, the demographic groups most similar to Immigrants from Croatia are Immigrants from Korea (92.3%, a difference of 0.010%), Celtic (92.3%, a difference of 0.020%), Immigrants from Kuwait (92.3%, a difference of 0.020%), Swiss (92.3%, a difference of 0.020%), and Icelander (92.3%, a difference of 0.030%).
| Demographics | Rating | Rank | 12th Grade, No Diploma |
| Immigrants | Western Europe | 98.5 /100 | #93 | Exceptional 92.3% |
| Immigrants | Europe | 98.5 /100 | #94 | Exceptional 92.3% |
| Immigrants | North Macedonia | 98.5 /100 | #95 | Exceptional 92.3% |
| Icelanders | 98.5 /100 | #96 | Exceptional 92.3% |
| Celtics | 98.4 /100 | #97 | Exceptional 92.3% |
| Immigrants | Kuwait | 98.4 /100 | #98 | Exceptional 92.3% |
| Immigrants | Korea | 98.3 /100 | #99 | Exceptional 92.3% |
| Immigrants | Croatia | 98.3 /100 | #100 | Exceptional 92.3% |
| Swiss | 98.1 /100 | #101 | Exceptional 92.3% |
| Alaskan Athabascans | 98.1 /100 | #102 | Exceptional 92.3% |
| Immigrants | Norway | 98.1 /100 | #103 | Exceptional 92.3% |
| Lebanese | 97.6 /100 | #104 | Exceptional 92.2% |
| Immigrants | Belarus | 97.4 /100 | #105 | Exceptional 92.2% |
| Immigrants | Russia | 97.3 /100 | #106 | Exceptional 92.2% |
| Syrians | 97.2 /100 | #107 | Exceptional 92.2% |