Immigrants vs Costa Rican High School Diploma
COMPARE
Immigrants
Costa Rican
High School Diploma
High School Diploma Comparison
Immigrants
Costa Ricans
85.8%
HIGH SCHOOL DIPLOMA
0.0/ 100
METRIC RATING
295th/ 347
METRIC RANK
88.4%
HIGH SCHOOL DIPLOMA
9.6/ 100
METRIC RATING
219th/ 347
METRIC RANK
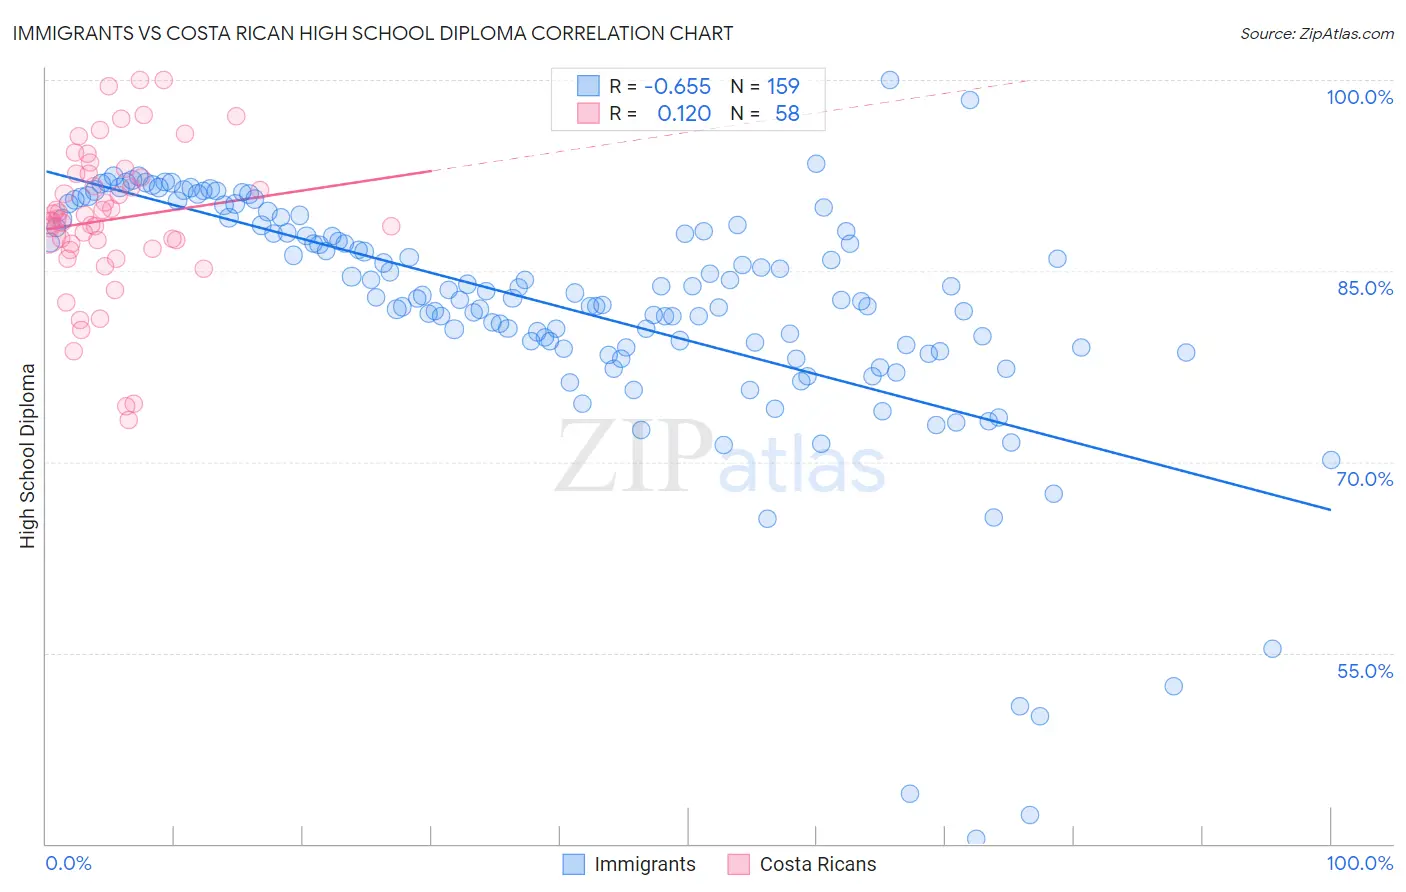
Immigrants vs Costa Rican High School Diploma Correlation Chart
The statistical analysis conducted on geographies consisting of 577,785,048 people shows a significant negative correlation between the proportion of Immigrants and percentage of population with at least high school diploma education in the United States with a correlation coefficient (R) of -0.655 and weighted average of 85.8%. Similarly, the statistical analysis conducted on geographies consisting of 253,601,730 people shows a poor positive correlation between the proportion of Costa Ricans and percentage of population with at least high school diploma education in the United States with a correlation coefficient (R) of 0.120 and weighted average of 88.4%, a difference of 3.0%.
High School Diploma Correlation Summary
| Measurement | Immigrants | Costa Rican |
| Minimum | 40.4% | 73.3% |
| Maximum | 100.0% | 100.0% |
| Range | 59.6% | 26.7% |
| Mean | 82.1% | 89.0% |
| Median | 83.1% | 89.0% |
| Interquartile 25% (IQ1) | 79.0% | 86.8% |
| Interquartile 75% (IQ3) | 88.6% | 92.7% |
| Interquartile Range (IQR) | 9.6% | 5.9% |
| Standard Deviation (Sample) | 9.7% | 5.9% |
| Standard Deviation (Population) | 9.7% | 5.8% |
Similar Demographics by High School Diploma
Demographics Similar to Immigrants by High School Diploma
In terms of high school diploma, the demographic groups most similar to Immigrants are Immigrants from Fiji (85.8%, a difference of 0.020%), British West Indian (85.9%, a difference of 0.050%), Japanese (85.9%, a difference of 0.070%), Haitian (85.9%, a difference of 0.080%), and Fijian (86.0%, a difference of 0.21%).
| Demographics | Rating | Rank | High School Diploma |
| Immigrants | Vietnam | 0.0 /100 | #288 | Tragic 86.2% |
| Yup'ik | 0.0 /100 | #289 | Tragic 86.1% |
| Fijians | 0.0 /100 | #290 | Tragic 86.0% |
| Haitians | 0.0 /100 | #291 | Tragic 85.9% |
| Japanese | 0.0 /100 | #292 | Tragic 85.9% |
| British West Indians | 0.0 /100 | #293 | Tragic 85.9% |
| Immigrants | Fiji | 0.0 /100 | #294 | Tragic 85.8% |
| Immigrants | Immigrants | 0.0 /100 | #295 | Tragic 85.8% |
| Immigrants | Cambodia | 0.0 /100 | #296 | Tragic 85.6% |
| Immigrants | Grenada | 0.0 /100 | #297 | Tragic 85.6% |
| Natives/Alaskans | 0.0 /100 | #298 | Tragic 85.6% |
| Guyanese | 0.0 /100 | #299 | Tragic 85.5% |
| Immigrants | Bangladesh | 0.0 /100 | #300 | Tragic 85.5% |
| Vietnamese | 0.0 /100 | #301 | Tragic 85.4% |
| Immigrants | Haiti | 0.0 /100 | #302 | Tragic 85.4% |
Demographics Similar to Costa Ricans by High School Diploma
In terms of high school diploma, the demographic groups most similar to Costa Ricans are Tongan (88.4%, a difference of 0.0%), Immigrants from Bolivia (88.4%, a difference of 0.030%), Immigrants from Africa (88.4%, a difference of 0.040%), Immigrants from Cameroon (88.4%, a difference of 0.050%), and Crow (88.4%, a difference of 0.050%).
| Demographics | Rating | Rank | High School Diploma |
| South American Indians | 12.2 /100 | #212 | Poor 88.5% |
| Immigrants | Somalia | 11.3 /100 | #213 | Poor 88.4% |
| Immigrants | Cameroon | 10.9 /100 | #214 | Poor 88.4% |
| Crow | 10.9 /100 | #215 | Poor 88.4% |
| Chickasaw | 10.7 /100 | #216 | Poor 88.4% |
| Immigrants | Africa | 10.6 /100 | #217 | Poor 88.4% |
| Immigrants | Bolivia | 10.3 /100 | #218 | Poor 88.4% |
| Costa Ricans | 9.6 /100 | #219 | Tragic 88.4% |
| Tongans | 9.5 /100 | #220 | Tragic 88.4% |
| Immigrants | Afghanistan | 8.6 /100 | #221 | Tragic 88.3% |
| Colville | 7.8 /100 | #222 | Tragic 88.3% |
| Immigrants | Zaire | 7.6 /100 | #223 | Tragic 88.3% |
| Shoshone | 7.0 /100 | #224 | Tragic 88.3% |
| Creek | 6.9 /100 | #225 | Tragic 88.3% |
| Uruguayans | 5.6 /100 | #226 | Tragic 88.2% |