Japanese vs British 3rd Grade
COMPARE
Japanese
British
3rd Grade
3rd Grade Comparison
Japanese
British
96.4%
3RD GRADE
0.0/ 100
METRIC RATING
327th/ 347
METRIC RANK
98.4%
3RD GRADE
99.9/ 100
METRIC RATING
36th/ 347
METRIC RANK
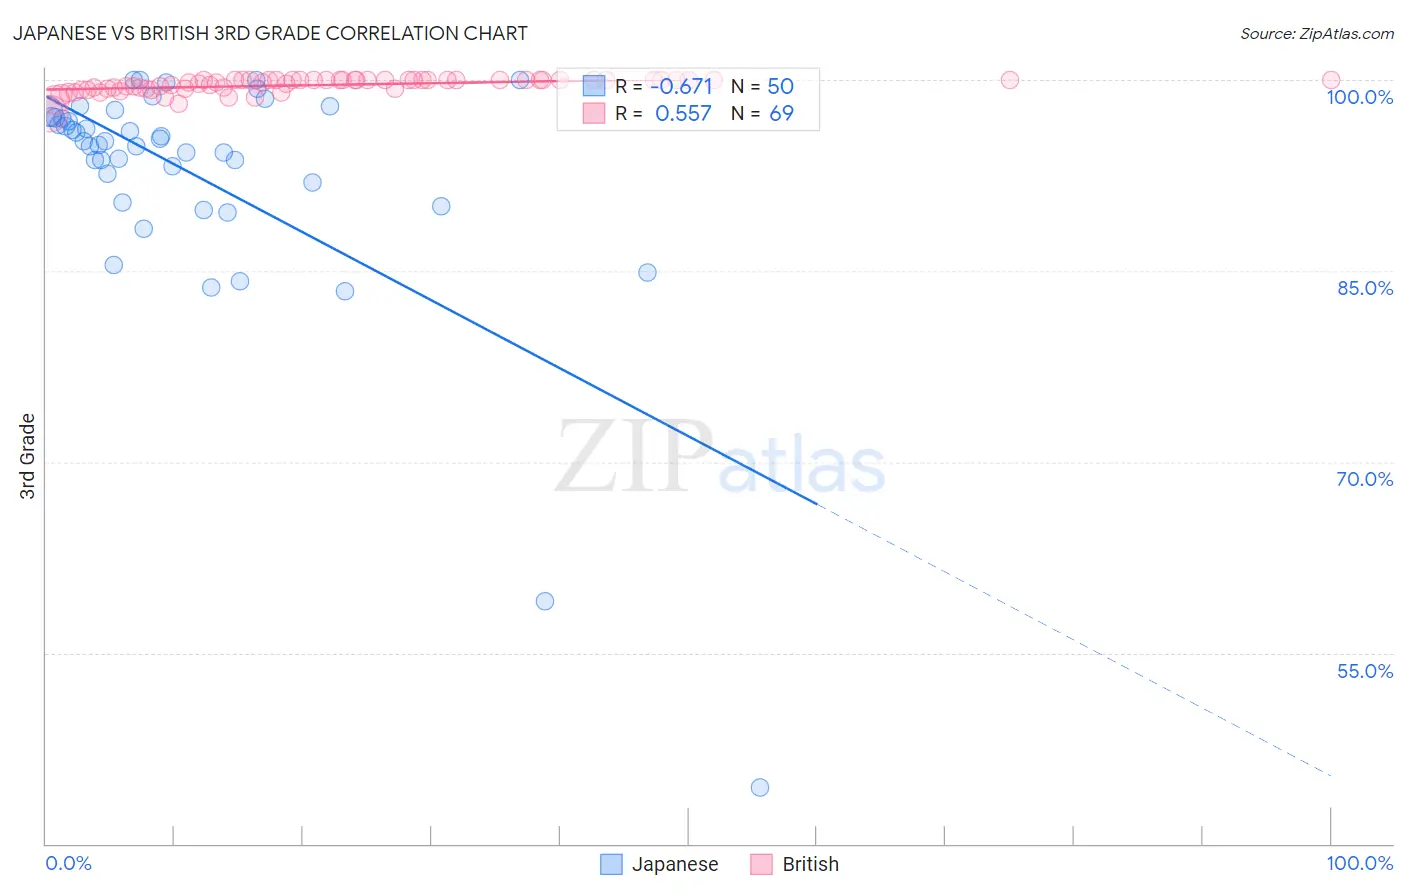
Japanese vs British 3rd Grade Correlation Chart
The statistical analysis conducted on geographies consisting of 249,183,224 people shows a significant negative correlation between the proportion of Japanese and percentage of population with at least 3rd grade education in the United States with a correlation coefficient (R) of -0.671 and weighted average of 96.4%. Similarly, the statistical analysis conducted on geographies consisting of 531,462,526 people shows a substantial positive correlation between the proportion of British and percentage of population with at least 3rd grade education in the United States with a correlation coefficient (R) of 0.557 and weighted average of 98.4%, a difference of 2.1%.
3rd Grade Correlation Summary
| Measurement | Japanese | British |
| Minimum | 44.4% | 97.4% |
| Maximum | 100.0% | 100.0% |
| Range | 55.6% | 2.6% |
| Mean | 92.7% | 99.6% |
| Median | 95.2% | 100.0% |
| Interquartile 25% (IQ1) | 92.0% | 99.3% |
| Interquartile 75% (IQ3) | 97.1% | 100.0% |
| Interquartile Range (IQR) | 5.1% | 0.65% |
| Standard Deviation (Sample) | 9.6% | 0.55% |
| Standard Deviation (Population) | 9.5% | 0.54% |
Similar Demographics by 3rd Grade
Demographics Similar to Japanese by 3rd Grade
In terms of 3rd grade, the demographic groups most similar to Japanese are Immigrants from Vietnam (96.4%, a difference of 0.010%), Bangladeshi (96.3%, a difference of 0.010%), Immigrants from Honduras (96.3%, a difference of 0.020%), Mexican American Indian (96.4%, a difference of 0.040%), and Dominican (96.4%, a difference of 0.060%).
| Demographics | Rating | Rank | 3rd Grade |
| Immigrants | Nicaragua | 0.0 /100 | #320 | Tragic 96.5% |
| Indonesians | 0.0 /100 | #321 | Tragic 96.5% |
| Immigrants | Belize | 0.0 /100 | #322 | Tragic 96.5% |
| Hondurans | 0.0 /100 | #323 | Tragic 96.5% |
| Dominicans | 0.0 /100 | #324 | Tragic 96.4% |
| Mexican American Indians | 0.0 /100 | #325 | Tragic 96.4% |
| Immigrants | Vietnam | 0.0 /100 | #326 | Tragic 96.4% |
| Japanese | 0.0 /100 | #327 | Tragic 96.4% |
| Bangladeshis | 0.0 /100 | #328 | Tragic 96.3% |
| Immigrants | Honduras | 0.0 /100 | #329 | Tragic 96.3% |
| Immigrants | Armenia | 0.0 /100 | #330 | Tragic 96.3% |
| Immigrants | Latin America | 0.0 /100 | #331 | Tragic 96.2% |
| Mexicans | 0.0 /100 | #332 | Tragic 96.2% |
| Immigrants | Fiji | 0.0 /100 | #333 | Tragic 96.2% |
| Immigrants | Cambodia | 0.0 /100 | #334 | Tragic 96.2% |
Demographics Similar to British by 3rd Grade
In terms of 3rd grade, the demographic groups most similar to British are Arapaho (98.4%, a difference of 0.010%), Italian (98.4%, a difference of 0.010%), Chippewa (98.4%, a difference of 0.010%), Chinese (98.4%, a difference of 0.020%), and Swiss (98.4%, a difference of 0.020%).
| Demographics | Rating | Rank | 3rd Grade |
| French Canadians | 100.0 /100 | #29 | Exceptional 98.4% |
| Europeans | 100.0 /100 | #30 | Exceptional 98.4% |
| Czechs | 100.0 /100 | #31 | Exceptional 98.4% |
| Scandinavians | 100.0 /100 | #32 | Exceptional 98.4% |
| Chinese | 100.0 /100 | #33 | Exceptional 98.4% |
| Swiss | 100.0 /100 | #34 | Exceptional 98.4% |
| Arapaho | 100.0 /100 | #35 | Exceptional 98.4% |
| British | 99.9 /100 | #36 | Exceptional 98.4% |
| Italians | 99.9 /100 | #37 | Exceptional 98.4% |
| Chippewa | 99.9 /100 | #38 | Exceptional 98.4% |
| Latvians | 99.9 /100 | #39 | Exceptional 98.4% |
| Eastern Europeans | 99.9 /100 | #40 | Exceptional 98.3% |
| Luxembourgers | 99.9 /100 | #41 | Exceptional 98.3% |
| Belgians | 99.9 /100 | #42 | Exceptional 98.3% |
| Northern Europeans | 99.9 /100 | #43 | Exceptional 98.3% |