Immigrants from Kazakhstan vs Immigrants from Poland 12th Grade, No Diploma
COMPARE
Immigrants from Kazakhstan
Immigrants from Poland
12th Grade, No Diploma
12th Grade, No Diploma Comparison
Immigrants from Kazakhstan
Immigrants from Poland
91.9%
12TH GRADE, NO DIPLOMA
94.2/ 100
METRIC RATING
120th/ 347
METRIC RANK
91.6%
12TH GRADE, NO DIPLOMA
82.3/ 100
METRIC RATING
140th/ 347
METRIC RANK
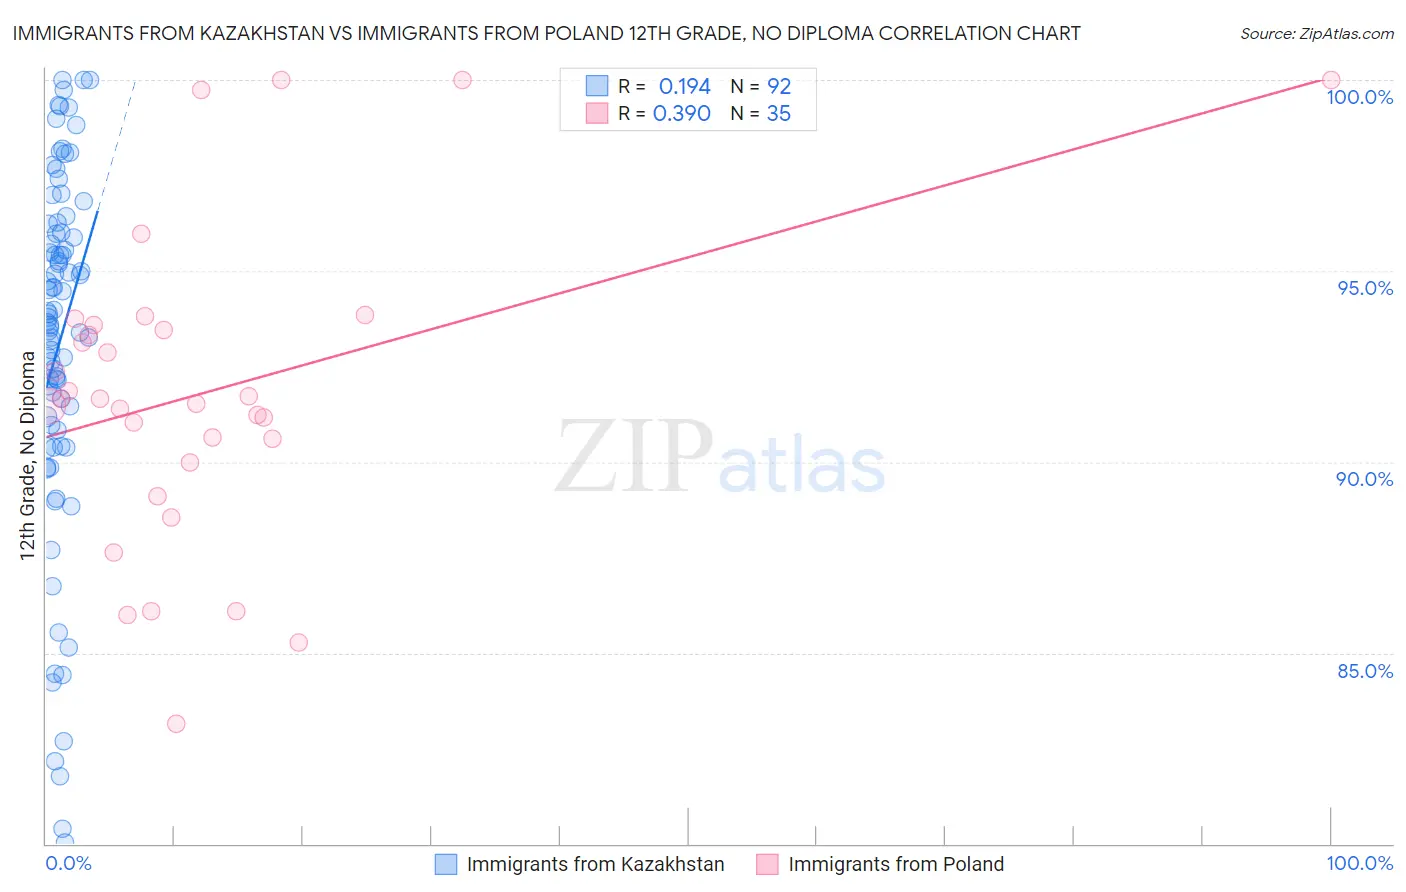
Immigrants from Kazakhstan vs Immigrants from Poland 12th Grade, No Diploma Correlation Chart
The statistical analysis conducted on geographies consisting of 124,444,172 people shows a poor positive correlation between the proportion of Immigrants from Kazakhstan and percentage of population with at least 12th grade (no diploma) education in the United States with a correlation coefficient (R) of 0.194 and weighted average of 91.9%. Similarly, the statistical analysis conducted on geographies consisting of 304,861,877 people shows a mild positive correlation between the proportion of Immigrants from Poland and percentage of population with at least 12th grade (no diploma) education in the United States with a correlation coefficient (R) of 0.390 and weighted average of 91.6%, a difference of 0.38%.
12th Grade, No Diploma Correlation Summary
| Measurement | Immigrants from Kazakhstan | Immigrants from Poland |
| Minimum | 80.0% | 83.1% |
| Maximum | 100.0% | 100.0% |
| Range | 20.0% | 16.9% |
| Mean | 93.1% | 91.8% |
| Median | 93.7% | 91.7% |
| Interquartile 25% (IQ1) | 90.9% | 90.0% |
| Interquartile 75% (IQ3) | 96.0% | 93.6% |
| Interquartile Range (IQR) | 5.1% | 3.6% |
| Standard Deviation (Sample) | 4.6% | 4.1% |
| Standard Deviation (Population) | 4.6% | 4.0% |
Demographics Similar to Immigrants from Kazakhstan and Immigrants from Poland by 12th Grade, No Diploma
In terms of 12th grade, no diploma, the demographic groups most similar to Immigrants from Kazakhstan are Menominee (91.9%, a difference of 0.030%), Ottawa (91.9%, a difference of 0.050%), Egyptian (91.9%, a difference of 0.080%), Immigrants from Ukraine (91.8%, a difference of 0.12%), and White/Caucasian (91.8%, a difference of 0.12%). Similarly, the demographic groups most similar to Immigrants from Poland are Immigrants from Egypt (91.6%, a difference of 0.030%), Arab (91.6%, a difference of 0.040%), Alaska Native (91.6%, a difference of 0.060%), Chilean (91.7%, a difference of 0.080%), and Immigrants from Bosnia and Herzegovina (91.7%, a difference of 0.12%).
| Demographics | Rating | Rank | 12th Grade, No Diploma |
| Immigrants | Kazakhstan | 94.2 /100 | #120 | Exceptional 91.9% |
| Menominee | 93.5 /100 | #121 | Exceptional 91.9% |
| Ottawa | 93.1 /100 | #122 | Exceptional 91.9% |
| Egyptians | 92.5 /100 | #123 | Exceptional 91.9% |
| Immigrants | Ukraine | 91.6 /100 | #124 | Exceptional 91.8% |
| Whites/Caucasians | 91.6 /100 | #125 | Exceptional 91.8% |
| Basques | 91.3 /100 | #126 | Exceptional 91.8% |
| Immigrants | Jordan | 91.0 /100 | #127 | Exceptional 91.8% |
| Mongolians | 89.9 /100 | #128 | Excellent 91.8% |
| German Russians | 89.8 /100 | #129 | Excellent 91.8% |
| Assyrians/Chaldeans/Syriacs | 89.6 /100 | #130 | Excellent 91.8% |
| Albanians | 89.3 /100 | #131 | Excellent 91.8% |
| Immigrants | Eastern Asia | 89.3 /100 | #132 | Excellent 91.8% |
| Immigrants | Italy | 88.3 /100 | #133 | Excellent 91.7% |
| Venezuelans | 88.2 /100 | #134 | Excellent 91.7% |
| Immigrants | Bosnia and Herzegovina | 87.3 /100 | #135 | Excellent 91.7% |
| Chileans | 85.8 /100 | #136 | Excellent 91.7% |
| Alaska Natives | 84.9 /100 | #137 | Excellent 91.6% |
| Arabs | 84.1 /100 | #138 | Excellent 91.6% |
| Immigrants | Egypt | 83.9 /100 | #139 | Excellent 91.6% |
| Immigrants | Poland | 82.3 /100 | #140 | Excellent 91.6% |