Indonesian vs Tsimshian 6th Grade
COMPARE
Indonesian
Tsimshian
6th Grade
6th Grade Comparison
Indonesians
Tsimshian
95.6%
6TH GRADE
0.0/ 100
METRIC RATING
304th/ 347
METRIC RANK
98.3%
6TH GRADE
100.0/ 100
METRIC RATING
5th/ 347
METRIC RANK
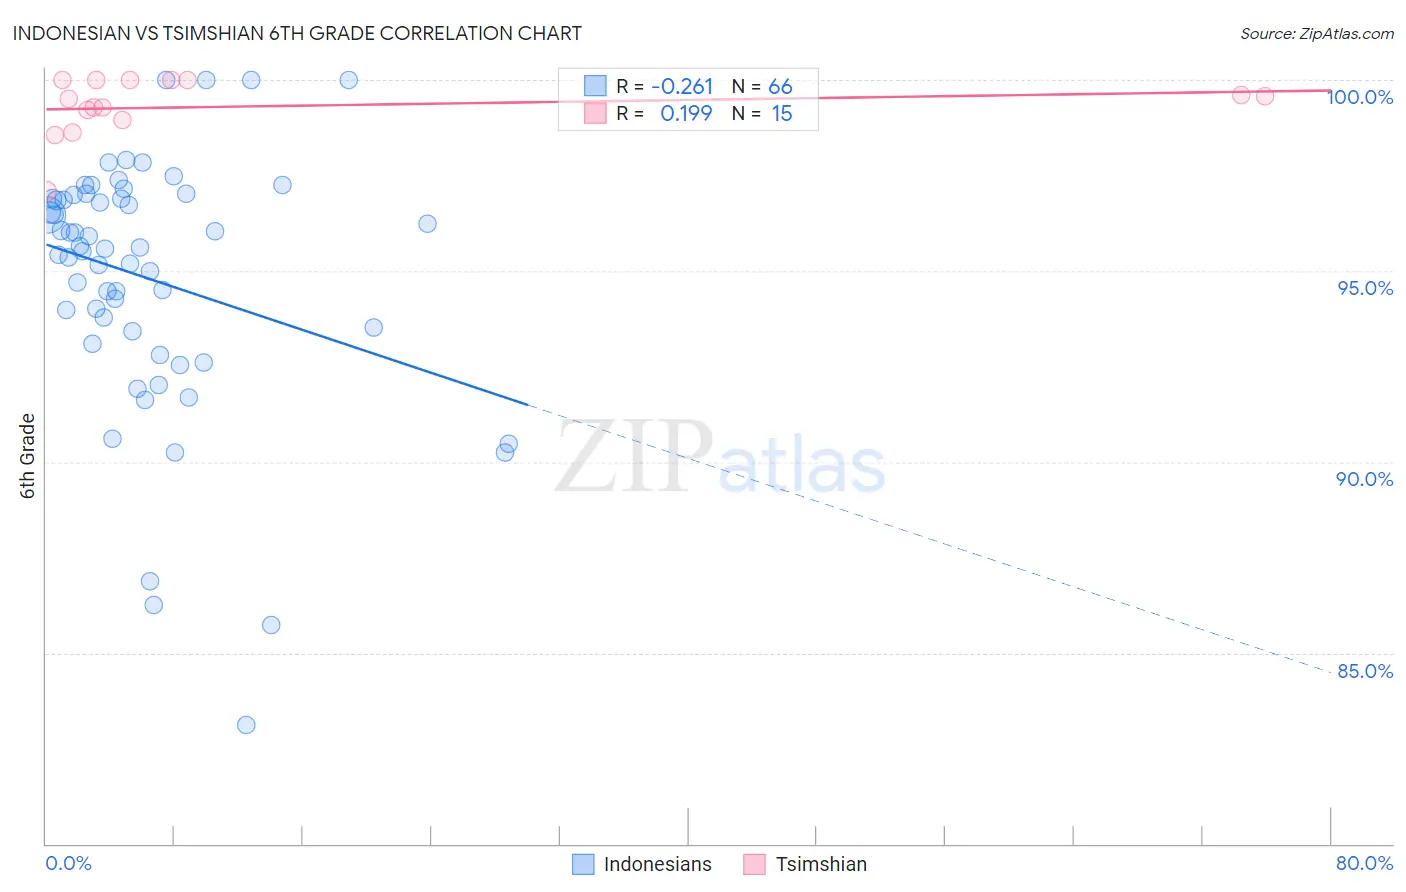
Indonesian vs Tsimshian 6th Grade Correlation Chart
The statistical analysis conducted on geographies consisting of 162,727,113 people shows a weak negative correlation between the proportion of Indonesians and percentage of population with at least 6th grade education in the United States with a correlation coefficient (R) of -0.261 and weighted average of 95.6%. Similarly, the statistical analysis conducted on geographies consisting of 15,626,544 people shows a poor positive correlation between the proportion of Tsimshian and percentage of population with at least 6th grade education in the United States with a correlation coefficient (R) of 0.199 and weighted average of 98.3%, a difference of 2.8%.
6th Grade Correlation Summary
| Measurement | Indonesian | Tsimshian |
| Minimum | 83.1% | 97.1% |
| Maximum | 100.0% | 100.0% |
| Range | 16.9% | 2.9% |
| Mean | 94.8% | 99.3% |
| Median | 95.6% | 99.5% |
| Interquartile 25% (IQ1) | 93.4% | 98.9% |
| Interquartile 75% (IQ3) | 96.9% | 100.0% |
| Interquartile Range (IQR) | 3.5% | 1.1% |
| Standard Deviation (Sample) | 3.3% | 0.79% |
| Standard Deviation (Population) | 3.3% | 0.76% |
Similar Demographics by 6th Grade
Demographics Similar to Indonesians by 6th Grade
In terms of 6th grade, the demographic groups most similar to Indonesians are Bangladeshi (95.7%, a difference of 0.010%), Immigrants from Cuba (95.6%, a difference of 0.020%), Immigrants from Haiti (95.6%, a difference of 0.060%), Immigrants from Burma/Myanmar (95.7%, a difference of 0.080%), and Guyanese (95.6%, a difference of 0.080%).
| Demographics | Rating | Rank | 6th Grade |
| Haitians | 0.0 /100 | #297 | Tragic 95.8% |
| Sri Lankans | 0.0 /100 | #298 | Tragic 95.8% |
| Immigrants | Laos | 0.0 /100 | #299 | Tragic 95.7% |
| Immigrants | Dominica | 0.0 /100 | #300 | Tragic 95.7% |
| Immigrants | Immigrants | 0.0 /100 | #301 | Tragic 95.7% |
| Immigrants | Burma/Myanmar | 0.0 /100 | #302 | Tragic 95.7% |
| Bangladeshis | 0.0 /100 | #303 | Tragic 95.7% |
| Indonesians | 0.0 /100 | #304 | Tragic 95.6% |
| Immigrants | Cuba | 0.0 /100 | #305 | Tragic 95.6% |
| Immigrants | Haiti | 0.0 /100 | #306 | Tragic 95.6% |
| Guyanese | 0.0 /100 | #307 | Tragic 95.6% |
| Immigrants | Caribbean | 0.0 /100 | #308 | Tragic 95.6% |
| Puerto Ricans | 0.0 /100 | #309 | Tragic 95.5% |
| Ecuadorians | 0.0 /100 | #310 | Tragic 95.5% |
| Immigrants | Portugal | 0.0 /100 | #311 | Tragic 95.5% |
Demographics Similar to Tsimshian by 6th Grade
In terms of 6th grade, the demographic groups most similar to Tsimshian are Norwegian (98.3%, a difference of 0.0%), German (98.2%, a difference of 0.040%), Slovak (98.2%, a difference of 0.050%), Dutch (98.4%, a difference of 0.070%), and Slovene (98.2%, a difference of 0.10%).
| Demographics | Rating | Rank | 6th Grade |
| Crow | 100.0 /100 | #1 | Exceptional 99.4% |
| Ottawa | 100.0 /100 | #2 | Exceptional 98.5% |
| Welsh | 100.0 /100 | #3 | Exceptional 98.5% |
| Dutch | 100.0 /100 | #4 | Exceptional 98.4% |
| Tsimshian | 100.0 /100 | #5 | Exceptional 98.3% |
| Norwegians | 100.0 /100 | #6 | Exceptional 98.3% |
| Germans | 100.0 /100 | #7 | Exceptional 98.2% |
| Slovaks | 100.0 /100 | #8 | Exceptional 98.2% |
| Slovenes | 100.0 /100 | #9 | Exceptional 98.2% |
| Swedes | 100.0 /100 | #10 | Exceptional 98.2% |
| English | 100.0 /100 | #11 | Exceptional 98.1% |
| Alaskan Athabascans | 100.0 /100 | #12 | Exceptional 98.1% |
| Tlingit-Haida | 100.0 /100 | #13 | Exceptional 98.1% |
| Carpatho Rusyns | 100.0 /100 | #14 | Exceptional 98.1% |
| Inupiat | 100.0 /100 | #15 | Exceptional 98.1% |