Indonesian vs Salvadoran 6th Grade
COMPARE
Indonesian
Salvadoran
6th Grade
6th Grade Comparison
Indonesians
Salvadorans
95.6%
6TH GRADE
0.0/ 100
METRIC RATING
304th/ 347
METRIC RANK
93.9%
6TH GRADE
0.0/ 100
METRIC RATING
345th/ 347
METRIC RANK
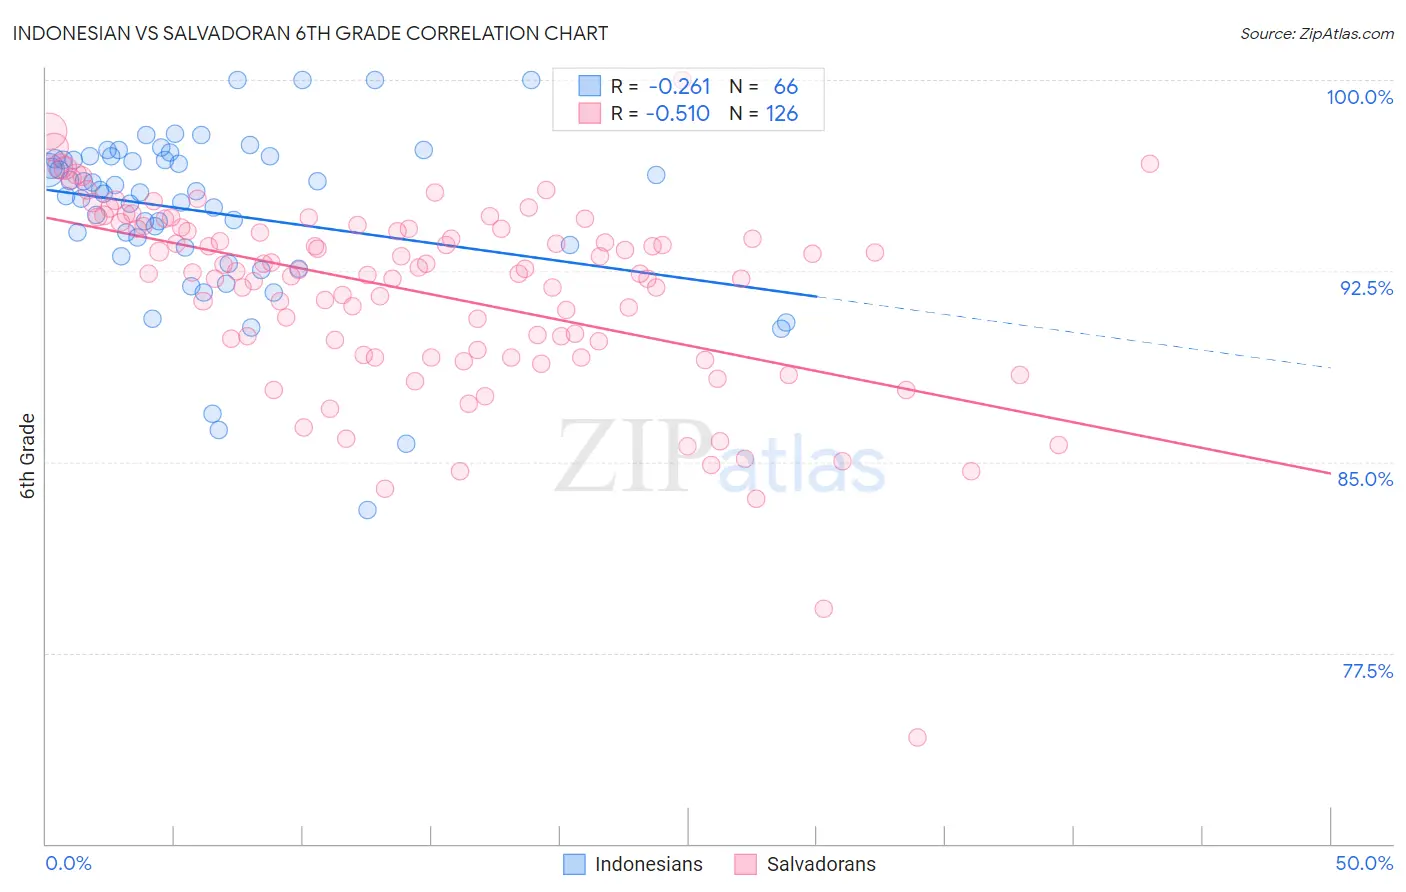
Indonesian vs Salvadoran 6th Grade Correlation Chart
The statistical analysis conducted on geographies consisting of 162,727,113 people shows a weak negative correlation between the proportion of Indonesians and percentage of population with at least 6th grade education in the United States with a correlation coefficient (R) of -0.261 and weighted average of 95.6%. Similarly, the statistical analysis conducted on geographies consisting of 399,033,726 people shows a substantial negative correlation between the proportion of Salvadorans and percentage of population with at least 6th grade education in the United States with a correlation coefficient (R) of -0.510 and weighted average of 93.9%, a difference of 1.8%.
6th Grade Correlation Summary
| Measurement | Indonesian | Salvadoran |
| Minimum | 83.1% | 74.2% |
| Maximum | 100.0% | 100.0% |
| Range | 16.9% | 25.8% |
| Mean | 94.8% | 91.6% |
| Median | 95.6% | 92.5% |
| Interquartile 25% (IQ1) | 93.4% | 89.4% |
| Interquartile 75% (IQ3) | 96.9% | 94.2% |
| Interquartile Range (IQR) | 3.5% | 4.8% |
| Standard Deviation (Sample) | 3.3% | 3.8% |
| Standard Deviation (Population) | 3.3% | 3.8% |
Similar Demographics by 6th Grade
Demographics Similar to Indonesians by 6th Grade
In terms of 6th grade, the demographic groups most similar to Indonesians are Bangladeshi (95.7%, a difference of 0.010%), Immigrants from Cuba (95.6%, a difference of 0.020%), Immigrants from Haiti (95.6%, a difference of 0.060%), Immigrants from Burma/Myanmar (95.7%, a difference of 0.080%), and Guyanese (95.6%, a difference of 0.080%).
| Demographics | Rating | Rank | 6th Grade |
| Haitians | 0.0 /100 | #297 | Tragic 95.8% |
| Sri Lankans | 0.0 /100 | #298 | Tragic 95.8% |
| Immigrants | Laos | 0.0 /100 | #299 | Tragic 95.7% |
| Immigrants | Dominica | 0.0 /100 | #300 | Tragic 95.7% |
| Immigrants | Immigrants | 0.0 /100 | #301 | Tragic 95.7% |
| Immigrants | Burma/Myanmar | 0.0 /100 | #302 | Tragic 95.7% |
| Bangladeshis | 0.0 /100 | #303 | Tragic 95.7% |
| Indonesians | 0.0 /100 | #304 | Tragic 95.6% |
| Immigrants | Cuba | 0.0 /100 | #305 | Tragic 95.6% |
| Immigrants | Haiti | 0.0 /100 | #306 | Tragic 95.6% |
| Guyanese | 0.0 /100 | #307 | Tragic 95.6% |
| Immigrants | Caribbean | 0.0 /100 | #308 | Tragic 95.6% |
| Puerto Ricans | 0.0 /100 | #309 | Tragic 95.5% |
| Ecuadorians | 0.0 /100 | #310 | Tragic 95.5% |
| Immigrants | Portugal | 0.0 /100 | #311 | Tragic 95.5% |
Demographics Similar to Salvadorans by 6th Grade
In terms of 6th grade, the demographic groups most similar to Salvadorans are Immigrants from Guatemala (93.9%, a difference of 0.0%), Immigrants from Mexico (93.9%, a difference of 0.010%), Immigrants from Central America (94.0%, a difference of 0.070%), Immigrants from Yemen (94.1%, a difference of 0.17%), and Guatemalan (94.2%, a difference of 0.28%).
| Demographics | Rating | Rank | 6th Grade |
| Immigrants | Latin America | 0.0 /100 | #333 | Tragic 94.7% |
| Immigrants | Azores | 0.0 /100 | #334 | Tragic 94.7% |
| Mexicans | 0.0 /100 | #335 | Tragic 94.6% |
| Immigrants | Dominican Republic | 0.0 /100 | #336 | Tragic 94.6% |
| Central Americans | 0.0 /100 | #337 | Tragic 94.5% |
| Immigrants | Cabo Verde | 0.0 /100 | #338 | Tragic 94.4% |
| Yakama | 0.0 /100 | #339 | Tragic 94.3% |
| Guatemalans | 0.0 /100 | #340 | Tragic 94.2% |
| Immigrants | Yemen | 0.0 /100 | #341 | Tragic 94.1% |
| Immigrants | Central America | 0.0 /100 | #342 | Tragic 94.0% |
| Immigrants | Mexico | 0.0 /100 | #343 | Tragic 93.9% |
| Immigrants | Guatemala | 0.0 /100 | #344 | Tragic 93.9% |
| Salvadorans | 0.0 /100 | #345 | Tragic 93.9% |
| Spanish American Indians | 0.0 /100 | #346 | Tragic 93.6% |
| Immigrants | El Salvador | 0.0 /100 | #347 | Tragic 93.6% |