Indonesian vs Tsimshian Female Poverty Among 25-34 Year Olds
COMPARE
Indonesian
Tsimshian
Female Poverty Among 25-34 Year Olds
Female Poverty Among 25-34 Year Olds Comparison
Indonesians
Tsimshian
16.4%
FEMALE POVERTY AMONG 25-34 YEAR OLDS
0.0/ 100
METRIC RATING
290th/ 347
METRIC RANK
12.7%
FEMALE POVERTY AMONG 25-34 YEAR OLDS
95.1/ 100
METRIC RATING
106th/ 347
METRIC RANK
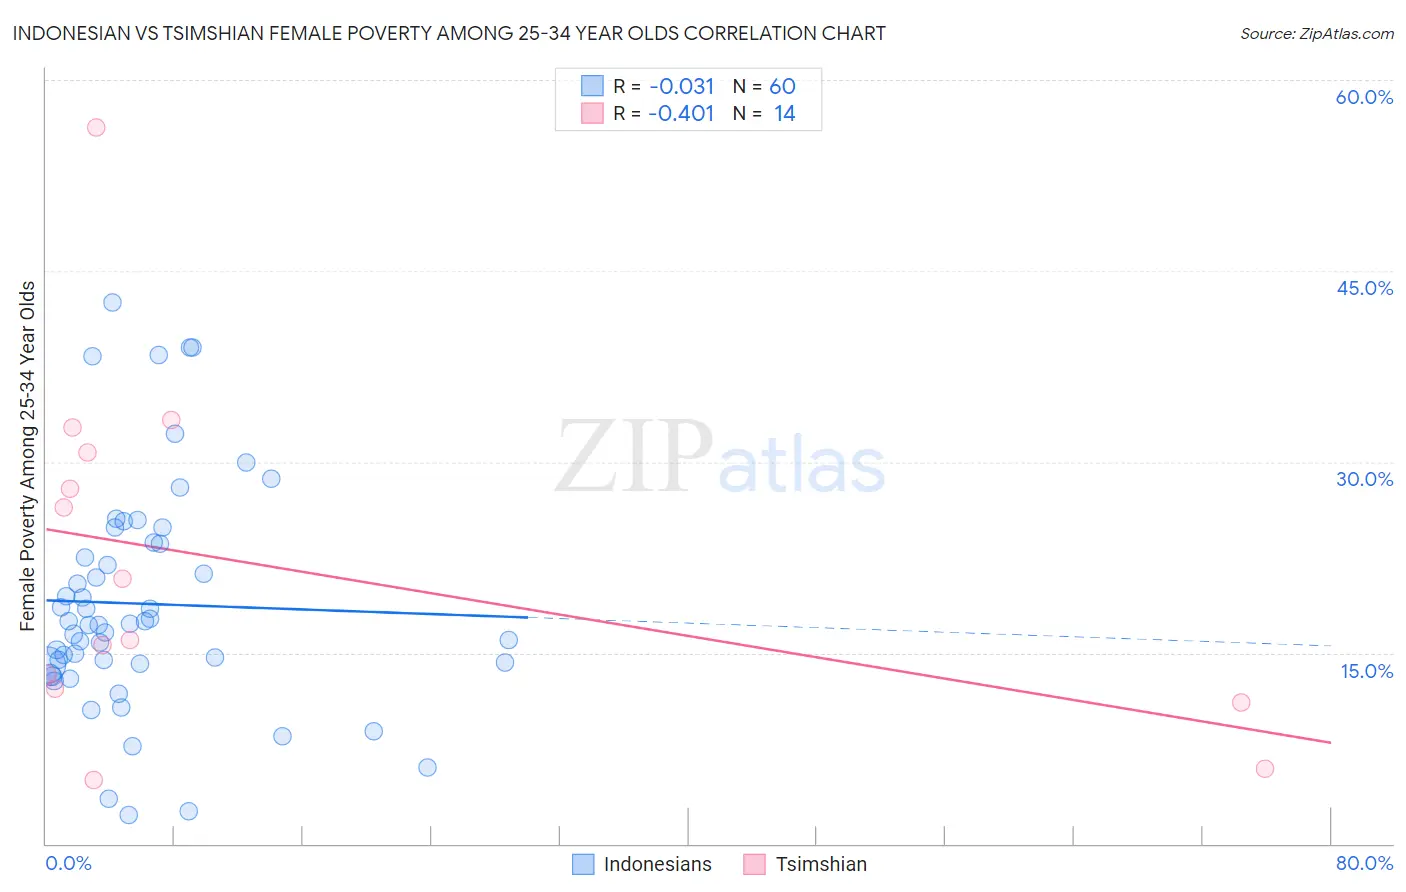
Indonesian vs Tsimshian Female Poverty Among 25-34 Year Olds Correlation Chart
The statistical analysis conducted on geographies consisting of 161,815,054 people shows no correlation between the proportion of Indonesians and poverty level among females between the ages 25 and 34 in the United States with a correlation coefficient (R) of -0.031 and weighted average of 16.4%. Similarly, the statistical analysis conducted on geographies consisting of 15,581,889 people shows a moderate negative correlation between the proportion of Tsimshian and poverty level among females between the ages 25 and 34 in the United States with a correlation coefficient (R) of -0.401 and weighted average of 12.7%, a difference of 29.3%.
Female Poverty Among 25-34 Year Olds Correlation Summary
| Measurement | Indonesian | Tsimshian |
| Minimum | 2.3% | 5.0% |
| Maximum | 42.5% | 56.2% |
| Range | 40.2% | 51.2% |
| Mean | 18.9% | 21.9% |
| Median | 17.2% | 18.4% |
| Interquartile 25% (IQ1) | 14.1% | 12.2% |
| Interquartile 75% (IQ3) | 23.6% | 30.8% |
| Interquartile Range (IQR) | 9.6% | 18.6% |
| Standard Deviation (Sample) | 8.9% | 13.8% |
| Standard Deviation (Population) | 8.9% | 13.3% |
Similar Demographics by Female Poverty Among 25-34 Year Olds
Demographics Similar to Indonesians by Female Poverty Among 25-34 Year Olds
In terms of female poverty among 25-34 year olds, the demographic groups most similar to Indonesians are Osage (16.4%, a difference of 0.16%), Guatemalan (16.4%, a difference of 0.22%), Comanche (16.5%, a difference of 0.28%), Immigrants from Dominica (16.5%, a difference of 0.30%), and American (16.4%, a difference of 0.40%).
| Demographics | Rating | Rank | Female Poverty Among 25-34 Year Olds |
| Bahamians | 0.0 /100 | #283 | Tragic 16.1% |
| Shoshone | 0.0 /100 | #284 | Tragic 16.2% |
| Immigrants | Bahamas | 0.0 /100 | #285 | Tragic 16.3% |
| Cape Verdeans | 0.0 /100 | #286 | Tragic 16.3% |
| Americans | 0.0 /100 | #287 | Tragic 16.4% |
| Guatemalans | 0.0 /100 | #288 | Tragic 16.4% |
| Osage | 0.0 /100 | #289 | Tragic 16.4% |
| Indonesians | 0.0 /100 | #290 | Tragic 16.4% |
| Comanche | 0.0 /100 | #291 | Tragic 16.5% |
| Immigrants | Dominica | 0.0 /100 | #292 | Tragic 16.5% |
| Potawatomi | 0.0 /100 | #293 | Tragic 16.5% |
| Immigrants | Central America | 0.0 /100 | #294 | Tragic 16.6% |
| Mexicans | 0.0 /100 | #295 | Tragic 16.6% |
| Hispanics or Latinos | 0.0 /100 | #296 | Tragic 16.6% |
| Immigrants | Guatemala | 0.0 /100 | #297 | Tragic 16.6% |
Demographics Similar to Tsimshian by Female Poverty Among 25-34 Year Olds
In terms of female poverty among 25-34 year olds, the demographic groups most similar to Tsimshian are Polish (12.7%, a difference of 0.050%), Immigrants from South Africa (12.7%, a difference of 0.10%), Swedish (12.7%, a difference of 0.15%), Immigrants from Spain (12.7%, a difference of 0.20%), and Peruvian (12.7%, a difference of 0.26%).
| Demographics | Rating | Rank | Female Poverty Among 25-34 Year Olds |
| Immigrants | Argentina | 96.4 /100 | #99 | Exceptional 12.6% |
| Immigrants | Denmark | 95.7 /100 | #100 | Exceptional 12.7% |
| Immigrants | Switzerland | 95.7 /100 | #101 | Exceptional 12.7% |
| Peruvians | 95.6 /100 | #102 | Exceptional 12.7% |
| Immigrants | Spain | 95.5 /100 | #103 | Exceptional 12.7% |
| Swedes | 95.4 /100 | #104 | Exceptional 12.7% |
| Immigrants | South Africa | 95.3 /100 | #105 | Exceptional 12.7% |
| Tsimshian | 95.1 /100 | #106 | Exceptional 12.7% |
| Poles | 94.9 /100 | #107 | Exceptional 12.7% |
| Immigrants | Norway | 94.4 /100 | #108 | Exceptional 12.7% |
| Immigrants | Peru | 94.3 /100 | #109 | Exceptional 12.7% |
| Australians | 94.1 /100 | #110 | Exceptional 12.8% |
| Danes | 93.9 /100 | #111 | Exceptional 12.8% |
| Immigrants | Morocco | 93.9 /100 | #112 | Exceptional 12.8% |
| Immigrants | Syria | 93.8 /100 | #113 | Exceptional 12.8% |