Indonesian vs Native Hawaiian 6th Grade
COMPARE
Indonesian
Native Hawaiian
6th Grade
6th Grade Comparison
Indonesians
Native Hawaiians
95.6%
6TH GRADE
0.0/ 100
METRIC RATING
304th/ 347
METRIC RANK
97.8%
6TH GRADE
99.9/ 100
METRIC RATING
47th/ 347
METRIC RANK
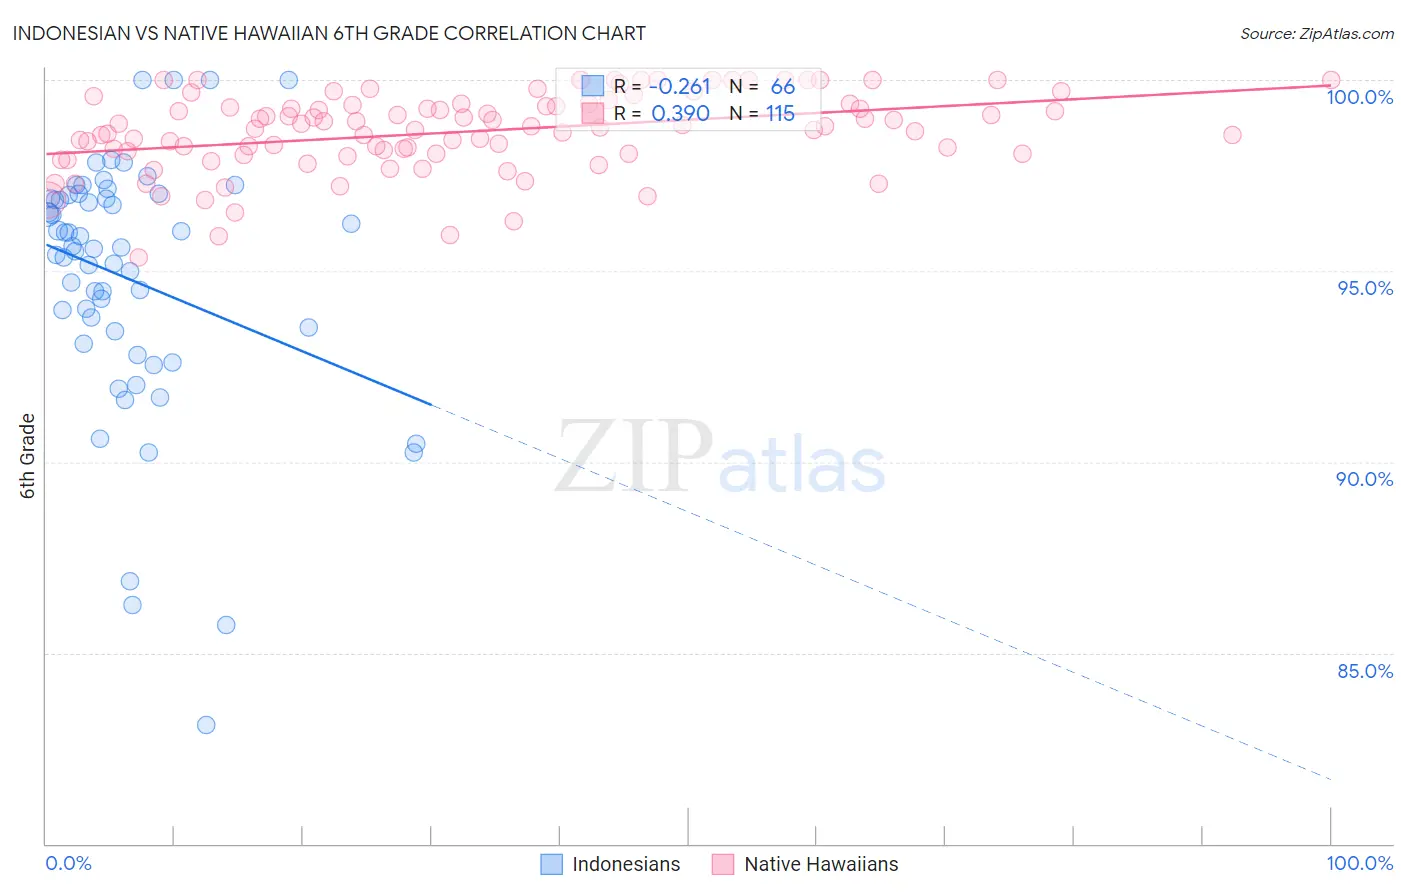
Indonesian vs Native Hawaiian 6th Grade Correlation Chart
The statistical analysis conducted on geographies consisting of 162,727,113 people shows a weak negative correlation between the proportion of Indonesians and percentage of population with at least 6th grade education in the United States with a correlation coefficient (R) of -0.261 and weighted average of 95.6%. Similarly, the statistical analysis conducted on geographies consisting of 332,114,258 people shows a mild positive correlation between the proportion of Native Hawaiians and percentage of population with at least 6th grade education in the United States with a correlation coefficient (R) of 0.390 and weighted average of 97.8%, a difference of 2.2%.
6th Grade Correlation Summary
| Measurement | Indonesian | Native Hawaiian |
| Minimum | 83.1% | 95.3% |
| Maximum | 100.0% | 100.0% |
| Range | 16.9% | 4.7% |
| Mean | 94.8% | 98.6% |
| Median | 95.6% | 98.8% |
| Interquartile 25% (IQ1) | 93.4% | 98.1% |
| Interquartile 75% (IQ3) | 96.9% | 99.4% |
| Interquartile Range (IQR) | 3.5% | 1.3% |
| Standard Deviation (Sample) | 3.3% | 1.0% |
| Standard Deviation (Population) | 3.3% | 1.0% |
Similar Demographics by 6th Grade
Demographics Similar to Indonesians by 6th Grade
In terms of 6th grade, the demographic groups most similar to Indonesians are Bangladeshi (95.7%, a difference of 0.010%), Immigrants from Cuba (95.6%, a difference of 0.020%), Immigrants from Haiti (95.6%, a difference of 0.060%), Immigrants from Burma/Myanmar (95.7%, a difference of 0.080%), and Guyanese (95.6%, a difference of 0.080%).
| Demographics | Rating | Rank | 6th Grade |
| Haitians | 0.0 /100 | #297 | Tragic 95.8% |
| Sri Lankans | 0.0 /100 | #298 | Tragic 95.8% |
| Immigrants | Laos | 0.0 /100 | #299 | Tragic 95.7% |
| Immigrants | Dominica | 0.0 /100 | #300 | Tragic 95.7% |
| Immigrants | Immigrants | 0.0 /100 | #301 | Tragic 95.7% |
| Immigrants | Burma/Myanmar | 0.0 /100 | #302 | Tragic 95.7% |
| Bangladeshis | 0.0 /100 | #303 | Tragic 95.7% |
| Indonesians | 0.0 /100 | #304 | Tragic 95.6% |
| Immigrants | Cuba | 0.0 /100 | #305 | Tragic 95.6% |
| Immigrants | Haiti | 0.0 /100 | #306 | Tragic 95.6% |
| Guyanese | 0.0 /100 | #307 | Tragic 95.6% |
| Immigrants | Caribbean | 0.0 /100 | #308 | Tragic 95.6% |
| Puerto Ricans | 0.0 /100 | #309 | Tragic 95.5% |
| Ecuadorians | 0.0 /100 | #310 | Tragic 95.5% |
| Immigrants | Portugal | 0.0 /100 | #311 | Tragic 95.5% |
Demographics Similar to Native Hawaiians by 6th Grade
In terms of 6th grade, the demographic groups most similar to Native Hawaiians are Celtic (97.8%, a difference of 0.0%), Estonian (97.8%, a difference of 0.0%), Immigrants from Scotland (97.8%, a difference of 0.0%), Arapaho (97.8%, a difference of 0.010%), and Maltese (97.8%, a difference of 0.010%).
| Demographics | Rating | Rank | 6th Grade |
| Latvians | 99.9 /100 | #40 | Exceptional 97.9% |
| Eastern Europeans | 99.9 /100 | #41 | Exceptional 97.9% |
| Hungarians | 99.9 /100 | #42 | Exceptional 97.8% |
| Northern Europeans | 99.9 /100 | #43 | Exceptional 97.8% |
| Czechoslovakians | 99.9 /100 | #44 | Exceptional 97.8% |
| Bulgarians | 99.9 /100 | #45 | Exceptional 97.8% |
| Arapaho | 99.9 /100 | #46 | Exceptional 97.8% |
| Native Hawaiians | 99.9 /100 | #47 | Exceptional 97.8% |
| Celtics | 99.9 /100 | #48 | Exceptional 97.8% |
| Estonians | 99.8 /100 | #49 | Exceptional 97.8% |
| Immigrants | Scotland | 99.8 /100 | #50 | Exceptional 97.8% |
| Maltese | 99.8 /100 | #51 | Exceptional 97.8% |
| Australians | 99.8 /100 | #52 | Exceptional 97.8% |
| Slavs | 99.8 /100 | #53 | Exceptional 97.8% |
| Creek | 99.8 /100 | #54 | Exceptional 97.7% |