Syrian vs Somali 8th Grade
COMPARE
Syrian
Somali
8th Grade
8th Grade Comparison
Syrians
Somalis
96.3%
8TH GRADE
96.7/ 100
METRIC RATING
112th/ 347
METRIC RANK
95.1%
8TH GRADE
1.4/ 100
METRIC RATING
246th/ 347
METRIC RANK
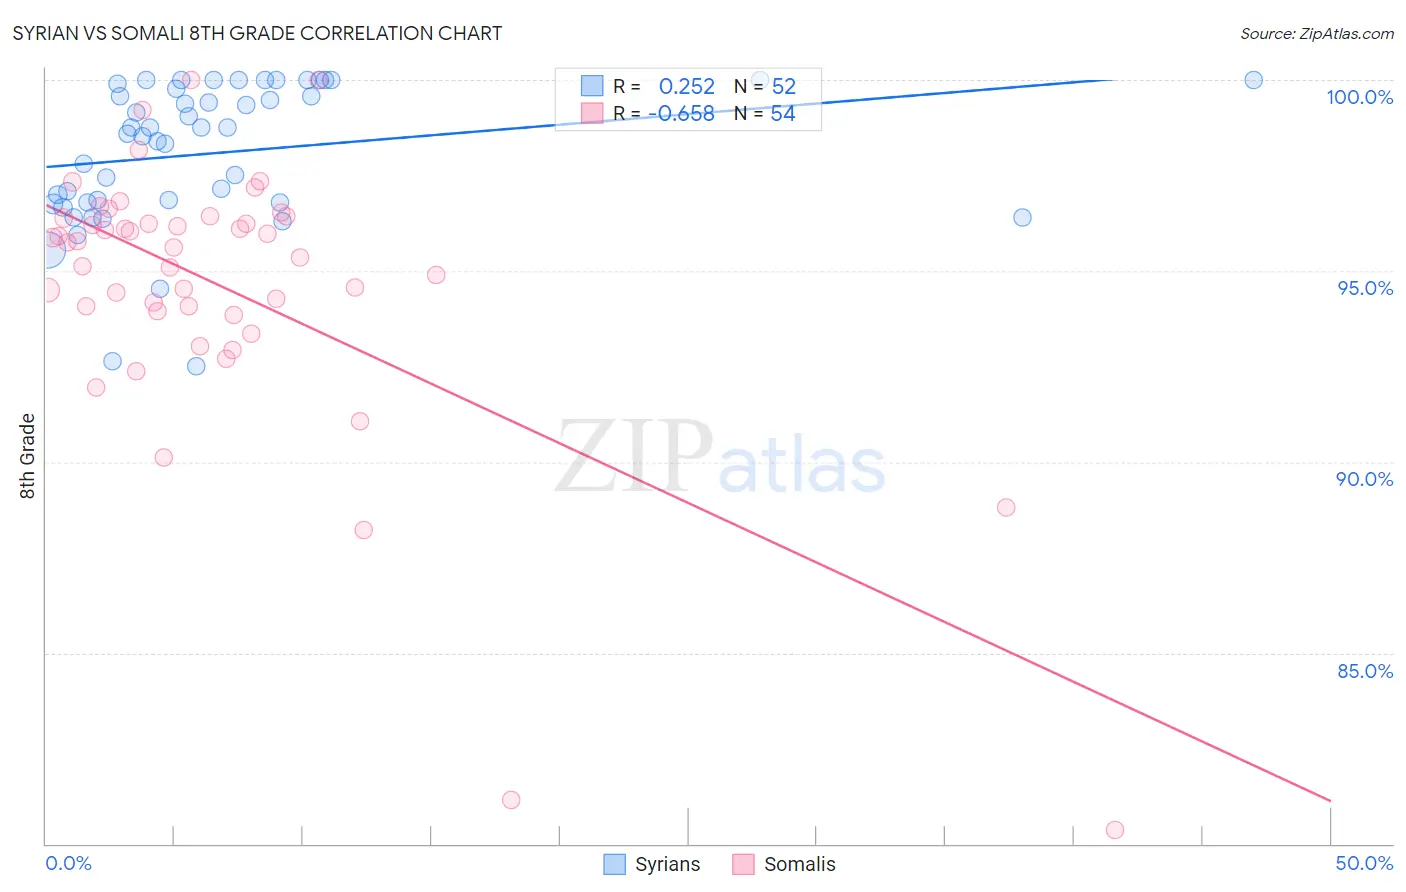
Syrian vs Somali 8th Grade Correlation Chart
The statistical analysis conducted on geographies consisting of 266,305,988 people shows a weak positive correlation between the proportion of Syrians and percentage of population with at least 8th grade education in the United States with a correlation coefficient (R) of 0.252 and weighted average of 96.3%. Similarly, the statistical analysis conducted on geographies consisting of 99,332,457 people shows a significant negative correlation between the proportion of Somalis and percentage of population with at least 8th grade education in the United States with a correlation coefficient (R) of -0.658 and weighted average of 95.1%, a difference of 1.3%.
8th Grade Correlation Summary
| Measurement | Syrian | Somali |
| Minimum | 92.5% | 80.4% |
| Maximum | 100.0% | 100.0% |
| Range | 7.5% | 19.6% |
| Mean | 98.1% | 94.6% |
| Median | 98.7% | 95.7% |
| Interquartile 25% (IQ1) | 96.8% | 94.0% |
| Interquartile 75% (IQ3) | 99.8% | 96.4% |
| Interquartile Range (IQR) | 3.0% | 2.4% |
| Standard Deviation (Sample) | 1.9% | 3.6% |
| Standard Deviation (Population) | 1.9% | 3.6% |
Similar Demographics by 8th Grade
Demographics Similar to Syrians by 8th Grade
In terms of 8th grade, the demographic groups most similar to Syrians are Shoshone (96.3%, a difference of 0.0%), Immigrants from Zimbabwe (96.3%, a difference of 0.0%), Immigrants from Japan (96.2%, a difference of 0.010%), Immigrants from Moldova (96.2%, a difference of 0.010%), and Cajun (96.3%, a difference of 0.020%).
| Demographics | Rating | Rank | 8th Grade |
| Immigrants | North Macedonia | 98.0 /100 | #105 | Exceptional 96.3% |
| Okinawans | 98.0 /100 | #106 | Exceptional 96.3% |
| Immigrants | Latvia | 97.8 /100 | #107 | Exceptional 96.3% |
| Lebanese | 97.5 /100 | #108 | Exceptional 96.3% |
| Iroquois | 97.5 /100 | #109 | Exceptional 96.3% |
| Cajuns | 97.1 /100 | #110 | Exceptional 96.3% |
| Shoshone | 96.8 /100 | #111 | Exceptional 96.3% |
| Syrians | 96.7 /100 | #112 | Exceptional 96.3% |
| Immigrants | Zimbabwe | 96.7 /100 | #113 | Exceptional 96.3% |
| Immigrants | Japan | 96.5 /100 | #114 | Exceptional 96.2% |
| Immigrants | Moldova | 96.5 /100 | #115 | Exceptional 96.2% |
| Immigrants | Nonimmigrants | 96.0 /100 | #116 | Exceptional 96.2% |
| Immigrants | Croatia | 96.0 /100 | #117 | Exceptional 96.2% |
| Immigrants | Norway | 95.7 /100 | #118 | Exceptional 96.2% |
| Immigrants | Switzerland | 95.3 /100 | #119 | Exceptional 96.2% |
Demographics Similar to Somalis by 8th Grade
In terms of 8th grade, the demographic groups most similar to Somalis are Immigrants from Senegal (95.1%, a difference of 0.0%), Jamaican (95.1%, a difference of 0.010%), Uruguayan (95.1%, a difference of 0.020%), Tongan (95.1%, a difference of 0.040%), and Paiute (95.1%, a difference of 0.040%).
| Demographics | Rating | Rank | 8th Grade |
| Immigrants | Sierra Leone | 2.1 /100 | #239 | Tragic 95.1% |
| Ethiopians | 2.0 /100 | #240 | Tragic 95.1% |
| South American Indians | 1.9 /100 | #241 | Tragic 95.1% |
| Tongans | 1.7 /100 | #242 | Tragic 95.1% |
| Paiute | 1.7 /100 | #243 | Tragic 95.1% |
| Immigrants | Middle Africa | 1.7 /100 | #244 | Tragic 95.1% |
| Jamaicans | 1.4 /100 | #245 | Tragic 95.1% |
| Somalis | 1.4 /100 | #246 | Tragic 95.1% |
| Immigrants | Senegal | 1.4 /100 | #247 | Tragic 95.1% |
| Uruguayans | 1.2 /100 | #248 | Tragic 95.1% |
| Immigrants | China | 1.1 /100 | #249 | Tragic 95.0% |
| Koreans | 1.1 /100 | #250 | Tragic 95.0% |
| Bolivians | 1.0 /100 | #251 | Tragic 95.0% |
| Immigrants | Ethiopia | 1.0 /100 | #252 | Tragic 95.0% |
| U.S. Virgin Islanders | 0.9 /100 | #253 | Tragic 95.0% |