Czechoslovakian vs Native Hawaiian 6th Grade
COMPARE
Czechoslovakian
Native Hawaiian
6th Grade
6th Grade Comparison
Czechoslovakians
Native Hawaiians
97.8%
6TH GRADE
99.9/ 100
METRIC RATING
44th/ 347
METRIC RANK
97.8%
6TH GRADE
99.9/ 100
METRIC RATING
47th/ 347
METRIC RANK
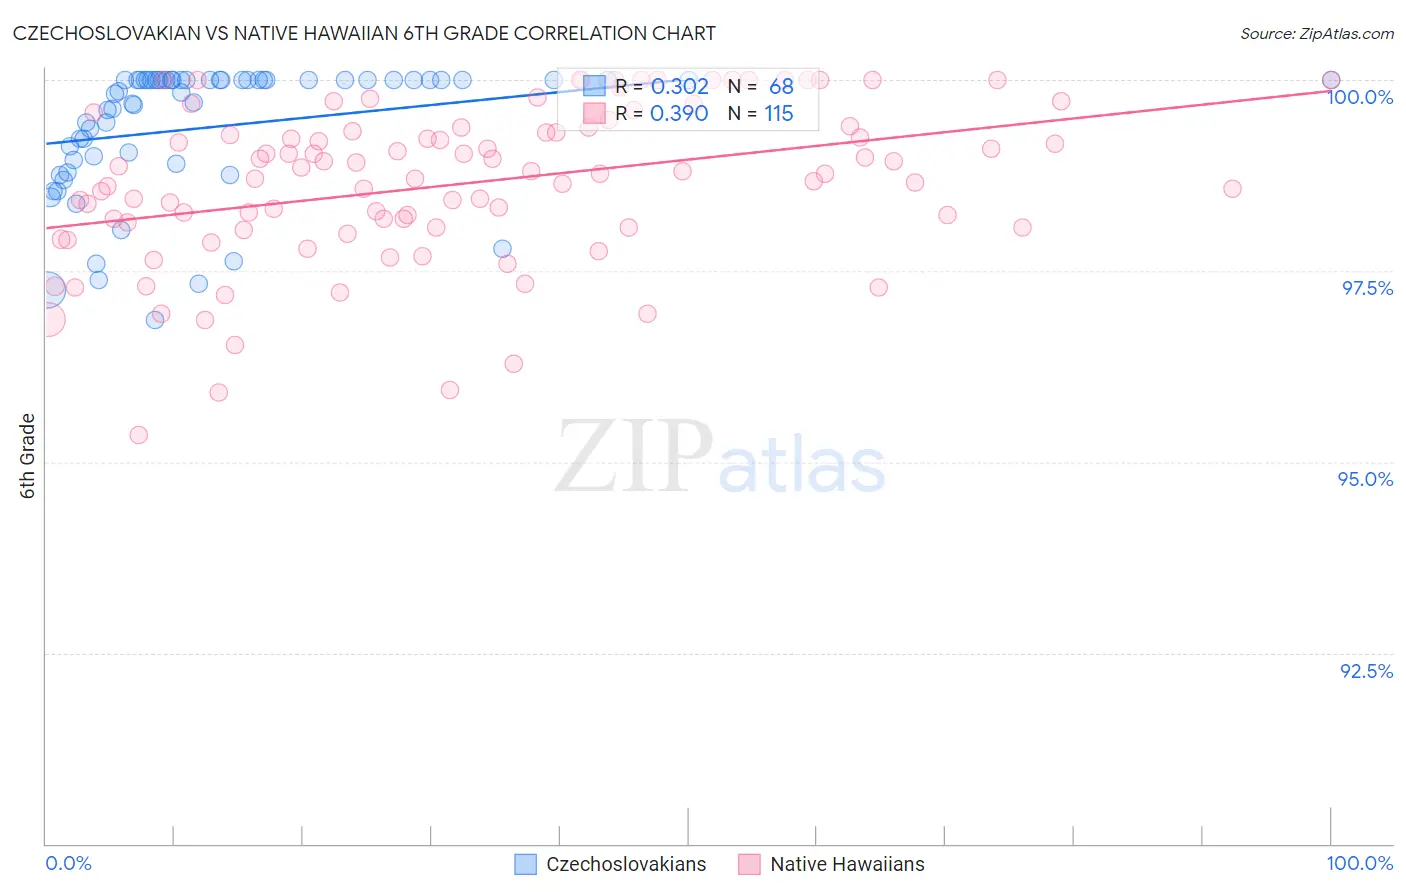
Czechoslovakian vs Native Hawaiian 6th Grade Correlation Chart
The statistical analysis conducted on geographies consisting of 368,657,544 people shows a mild positive correlation between the proportion of Czechoslovakians and percentage of population with at least 6th grade education in the United States with a correlation coefficient (R) of 0.302 and weighted average of 97.8%. Similarly, the statistical analysis conducted on geographies consisting of 332,114,258 people shows a mild positive correlation between the proportion of Native Hawaiians and percentage of population with at least 6th grade education in the United States with a correlation coefficient (R) of 0.390 and weighted average of 97.8%, a difference of 0.040%.
6th Grade Correlation Summary
| Measurement | Czechoslovakian | Native Hawaiian |
| Minimum | 96.9% | 95.3% |
| Maximum | 100.0% | 100.0% |
| Range | 3.1% | 4.7% |
| Mean | 99.4% | 98.6% |
| Median | 99.9% | 98.8% |
| Interquartile 25% (IQ1) | 98.9% | 98.1% |
| Interquartile 75% (IQ3) | 100.0% | 99.4% |
| Interquartile Range (IQR) | 1.1% | 1.3% |
| Standard Deviation (Sample) | 0.86% | 1.0% |
| Standard Deviation (Population) | 0.85% | 1.0% |
Demographics Similar to Czechoslovakians and Native Hawaiians by 6th Grade
In terms of 6th grade, the demographic groups most similar to Czechoslovakians are Bulgarian (97.8%, a difference of 0.020%), Northern European (97.8%, a difference of 0.030%), Arapaho (97.8%, a difference of 0.030%), Hungarian (97.8%, a difference of 0.040%), and Celtic (97.8%, a difference of 0.040%). Similarly, the demographic groups most similar to Native Hawaiians are Celtic (97.8%, a difference of 0.0%), Estonian (97.8%, a difference of 0.0%), Immigrants from Scotland (97.8%, a difference of 0.0%), Arapaho (97.8%, a difference of 0.010%), and Maltese (97.8%, a difference of 0.010%).
| Demographics | Rating | Rank | 6th Grade |
| Chinese | 100.0 /100 | #35 | Exceptional 97.9% |
| Italians | 100.0 /100 | #36 | Exceptional 97.9% |
| British | 100.0 /100 | #37 | Exceptional 97.9% |
| Belgians | 100.0 /100 | #38 | Exceptional 97.9% |
| Luxembourgers | 99.9 /100 | #39 | Exceptional 97.9% |
| Latvians | 99.9 /100 | #40 | Exceptional 97.9% |
| Eastern Europeans | 99.9 /100 | #41 | Exceptional 97.9% |
| Hungarians | 99.9 /100 | #42 | Exceptional 97.8% |
| Northern Europeans | 99.9 /100 | #43 | Exceptional 97.8% |
| Czechoslovakians | 99.9 /100 | #44 | Exceptional 97.8% |
| Bulgarians | 99.9 /100 | #45 | Exceptional 97.8% |
| Arapaho | 99.9 /100 | #46 | Exceptional 97.8% |
| Native Hawaiians | 99.9 /100 | #47 | Exceptional 97.8% |
| Celtics | 99.9 /100 | #48 | Exceptional 97.8% |
| Estonians | 99.8 /100 | #49 | Exceptional 97.8% |
| Immigrants | Scotland | 99.8 /100 | #50 | Exceptional 97.8% |
| Maltese | 99.8 /100 | #51 | Exceptional 97.8% |
| Australians | 99.8 /100 | #52 | Exceptional 97.8% |
| Slavs | 99.8 /100 | #53 | Exceptional 97.8% |
| Creek | 99.8 /100 | #54 | Exceptional 97.7% |
| Aleuts | 99.8 /100 | #55 | Exceptional 97.7% |