Immigrants from Europe vs Immigrants from Norway Associate's Degree

COMPARE

Immigrants from Europe
Race
Ancestry
AfghanAfricanAlaska NativeAlaskan AthabascanAlbanianAleutAlsatianAmericanApacheArabArapahoArgentineanArmenianAssyrian/Chaldean/SyriacAustralianAustrianBahamianBangladeshiBarbadianBasqueBelgianBelizeanBermudanBhutaneseBlackfeetBolivianBrazilianBritishBritish West IndianBulgarianBurmeseCajunCambodianCanadianCape VerdeanCarpatho RusynCelticCentral AmericanCentral American IndianCherokeeCheyenneChickasawChileanChineseChippewaChoctawColombianColvilleComancheCosta RicanCreeCreekCroatianCrowCubanCypriotCzechCzechoslovakianDanishDelawareDominicanDutchDutch West IndianEastern EuropeanEcuadorianEgyptianEnglishEstonianEthiopianEuropeanFijianFilipinoFinnishFrenchFrench American IndianFrench CanadianGermanGerman RussianGhanaianGreekGuamanian/ChamorroGuatemalanGuyaneseHaitianHmongHonduranHopiHoumaHungarianIcelanderIndian (Asian)IndonesianInupiatIranianIraqiIrishIroquoisIsraeliItalianJamaicanJapaneseJordanianKenyanKiowaKoreanLaotianLatvianLebaneseLiberianLithuanianLumbeeLuxembourgerMacedonianMalaysianMalteseMarshalleseMenomineeMexicanMexican American IndianMongolianMoroccanNative HawaiianNavajoNepaleseNew ZealanderNicaraguanNigerianNorthern EuropeanNorwegianOkinawanOsageOttawaPaiutePakistaniPalestinianPanamanianParaguayanPennsylvania GermanPeruvianPimaPolishPortuguesePotawatomiPuebloPuerto RicanPuget Sound SalishRomanianRussianSalvadoranSamoanScandinavianScotch-IrishScottishSeminoleSenegaleseSerbianShoshoneSierra LeoneanSiouxSlavicSlovakSloveneSomaliSouth AfricanSouth AmericanSouth American IndianSoviet UnionSpaniardSpanishSpanish AmericanSpanish American IndianSri LankanSubsaharan AfricanSudaneseSwedishSwissSyrianTaiwaneseThaiTlingit-HaidaTohono O'OdhamTonganTrinidadian and TobagonianTsimshianTurkishU.S. Virgin IslanderUgandanUkrainianUruguayanUteVenezuelanVietnameseWelshWest IndianYakamaYaquiYugoslavianYumanYup'ikZimbabwean
Immigration
NonimmigrantsImmigrantsAfghanistanAfricaAlbaniaArgentinaArmeniaAsiaAustraliaAustriaBahamasBangladeshBarbadosBelarusBelgiumBelizeBoliviaBosnia and HerzegovinaBrazilBulgariaBurma/MyanmarCabo VerdeCambodiaCameroonCanadaCaribbeanCentral AmericaChileChinaColombiaCongoCosta RicaCroatiaCubaCzechoslovakiaDenmarkDominicaDominican RepublicEastern AfricaEastern AsiaEastern EuropeEcuadorEgyptEl SalvadorEnglandEritreaEthiopiaEuropeFijiFranceGermanyGhanaGreeceGrenadaGuatemalaGuyanaHaitiHondurasHong KongHungaryIndiaIndonesiaIranIraqIrelandIsraelItalyJamaicaJapanJordanKazakhstanKenyaKoreaKuwaitLaosLatin AmericaLatviaLebanonLiberiaLithuaniaMalaysiaMexicoMicronesiaMiddle AfricaMoldovaMoroccoNepalNetherlandsNicaraguaNigeriaNorth AmericaNorth MacedoniaNorthern AfricaNorthern EuropeOceaniaPakistanPanamaPeruPhilippinesPolandPortugalRomaniaRussiaSaudi ArabiaScotlandSenegalSerbiaSierra LeoneSingaporeSomaliaSouth AfricaSouth AmericaSouth Central AsiaSouth Eastern AsiaSouthern EuropeSpainSri LankaSt. Vincent and the GrenadinesSudanSwedenSwitzerlandSyriaTaiwanThailandTrinidad and TobagoTurkeyUgandaUkraineUruguayUzbekistanVenezuelaVietnamWest IndiesWestern AfricaWestern AsiaWestern EuropeYemenZaireZimbabweAzores
Immigrants from Norway
Race
Ancestry
AfghanAfricanAlaska NativeAlaskan AthabascanAlbanianAleutAlsatianAmericanApacheArabArapahoArgentineanArmenianAssyrian/Chaldean/SyriacAustralianAustrianBahamianBangladeshiBarbadianBasqueBelgianBelizeanBermudanBhutaneseBlackfeetBolivianBrazilianBritishBritish West IndianBulgarianBurmeseCajunCambodianCanadianCape VerdeanCarpatho RusynCelticCentral AmericanCentral American IndianCherokeeCheyenneChickasawChileanChineseChippewaChoctawColombianColvilleComancheCosta RicanCreeCreekCroatianCrowCubanCypriotCzechCzechoslovakianDanishDelawareDominicanDutchDutch West IndianEastern EuropeanEcuadorianEgyptianEnglishEstonianEthiopianEuropeanFijianFilipinoFinnishFrenchFrench American IndianFrench CanadianGermanGerman RussianGhanaianGreekGuamanian/ChamorroGuatemalanGuyaneseHaitianHmongHonduranHopiHoumaHungarianIcelanderIndian (Asian)IndonesianInupiatIranianIraqiIrishIroquoisIsraeliItalianJamaicanJapaneseJordanianKenyanKiowaKoreanLaotianLatvianLebaneseLiberianLithuanianLumbeeLuxembourgerMacedonianMalaysianMalteseMarshalleseMenomineeMexicanMexican American IndianMongolianMoroccanNative HawaiianNavajoNepaleseNew ZealanderNicaraguanNigerianNorthern EuropeanNorwegianOkinawanOsageOttawaPaiutePakistaniPalestinianPanamanianParaguayanPennsylvania GermanPeruvianPimaPolishPortuguesePotawatomiPuebloPuerto RicanPuget Sound SalishRomanianRussianSalvadoranSamoanScandinavianScotch-IrishScottishSeminoleSenegaleseSerbianShoshoneSierra LeoneanSiouxSlavicSlovakSloveneSomaliSouth AfricanSouth AmericanSouth American IndianSoviet UnionSpaniardSpanishSpanish AmericanSpanish American IndianSri LankanSubsaharan AfricanSudaneseSwedishSwissSyrianTaiwaneseThaiTlingit-HaidaTohono O'OdhamTonganTrinidadian and TobagonianTsimshianTurkishU.S. Virgin IslanderUgandanUkrainianUruguayanUteVenezuelanVietnameseWelshWest IndianYakamaYaquiYugoslavianYumanYup'ikZimbabwean
Immigration
NonimmigrantsImmigrantsAfghanistanAfricaAlbaniaArgentinaArmeniaAsiaAustraliaAustriaBahamasBangladeshBarbadosBelarusBelgiumBelizeBoliviaBosnia and HerzegovinaBrazilBulgariaBurma/MyanmarCabo VerdeCambodiaCameroonCanadaCaribbeanCentral AmericaChileChinaColombiaCongoCosta RicaCroatiaCubaCzechoslovakiaDenmarkDominicaDominican RepublicEastern AfricaEastern AsiaEastern EuropeEcuadorEgyptEl SalvadorEnglandEritreaEthiopiaFijiFranceGermanyGhanaGreeceGrenadaGuatemalaGuyanaHaitiHondurasHong KongHungaryIndiaIndonesiaIranIraqIrelandIsraelItalyJamaicaJapanJordanKazakhstanKenyaKoreaKuwaitLaosLatin AmericaLatviaLebanonLiberiaLithuaniaMalaysiaMexicoMicronesiaMiddle AfricaMoldovaMoroccoNepalNetherlandsNicaraguaNigeriaNorth AmericaNorth MacedoniaNorthern AfricaNorthern EuropeNorwayOceaniaPakistanPanamaPeruPhilippinesPolandPortugalRomaniaRussiaSaudi ArabiaScotlandSenegalSerbiaSierra LeoneSingaporeSomaliaSouth AfricaSouth AmericaSouth Central AsiaSouth Eastern AsiaSouthern EuropeSpainSri LankaSt. Vincent and the GrenadinesSudanSwedenSwitzerlandSyriaTaiwanThailandTrinidad and TobagoTurkeyUgandaUkraineUruguayUzbekistanVenezuelaVietnamWest IndiesWestern AfricaWestern AsiaWestern EuropeYemenZaireZimbabweAzores
Associate's Degree
Income
Poverty
Unemployment
Labor Participation
Family Structure
Vehicle Availability
Education Level
Disability

Associate's Degree Comparison

Immigrants from Europe

Immigrants from Norway

Exceptional
Exceptional
51.3%
ASSOCIATE'S DEGREE
99.7/ 100
METRIC RATING
66th/ 347
METRIC RANK
52.2%
ASSOCIATE'S DEGREE
99.9/ 100
METRIC RATING
48th/ 347
METRIC RANK

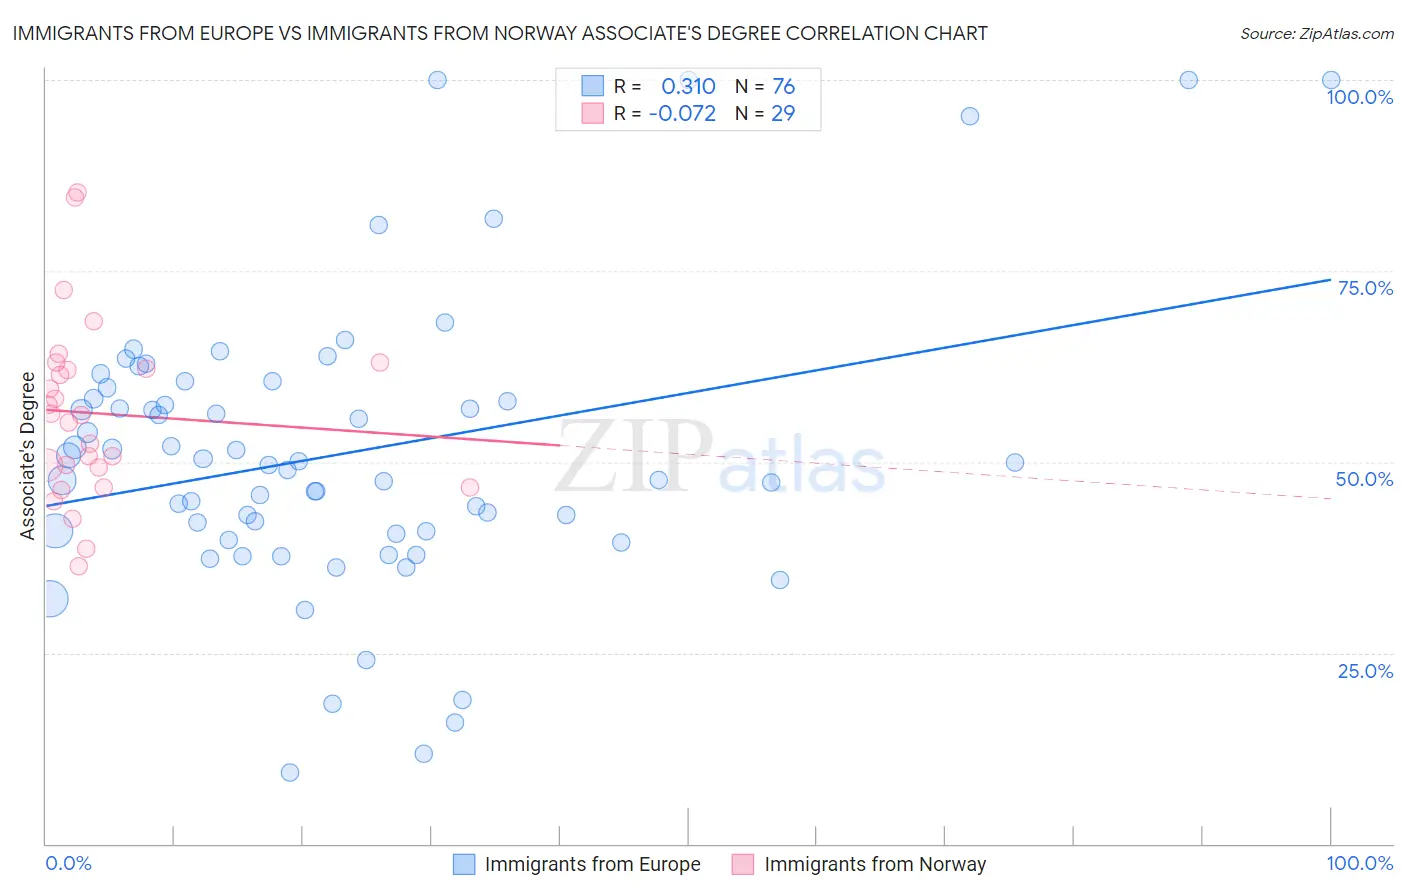
Immigrants from Europe vs Immigrants from Norway Associate's Degree Correlation Chart

The statistical analysis conducted on geographies consisting of 547,360,790 people shows a mild positive correlation between the proportion of Immigrants from Europe and percentage of population with at least associate's degree education in the United States with a correlation coefficient (R) of 0.310 and weighted average of 51.3%. Similarly, the statistical analysis conducted on geographies consisting of 116,713,778 people shows a slight negative correlation between the proportion of Immigrants from Norway and percentage of population with at least associate's degree education in the United States with a correlation coefficient (R) of -0.072 and weighted average of 52.2%, a difference of 1.8%.
Immigrants from Europe vs Immigrants from Norway Associate's Degree

Associate's Degree Correlation Summary

MeasurementImmigrants from EuropeImmigrants from Norway
Minimum9.3%36.3%
Maximum100.0%85.3%
Range90.7%49.0%
Mean51.1%56.3%
Median49.8%56.2%
Interquartile 25% (IQ1)40.8%47.9%
Interquartile 75% (IQ3)59.0%62.6%
Interquartile Range (IQR)18.2%14.7%
Standard Deviation (Sample)18.8%11.7%
Standard Deviation (Population)18.7%11.5%

Demographics Similar to Immigrants from Europe and Immigrants from Norway by Associate's Degree

In terms of associate's degree, the demographic groups most similar to Immigrants from Europe are Zimbabwean (51.3%, a difference of 0.050%), Immigrants from Netherlands (51.4%, a difference of 0.080%), Argentinean (51.2%, a difference of 0.13%), South African (51.4%, a difference of 0.16%), and Immigrants from Kazakhstan (51.4%, a difference of 0.21%). Similarly, the demographic groups most similar to Immigrants from Norway are Immigrants from Austria (52.1%, a difference of 0.20%), Asian (52.1%, a difference of 0.21%), Immigrants from Kuwait (52.4%, a difference of 0.26%), Immigrants from Greece (52.1%, a difference of 0.29%), and Bolivian (52.0%, a difference of 0.50%).
DemographicsRating | RankAssociate's Degree
Immigrants | Kuwait
99.9
/100
|
#47
Exceptional
52.4%
Immigrants | Norway
99.9
/100
|
#48
Exceptional
52.2%
Immigrants | Austria
99.9
/100
|
#49
Exceptional
52.1%
Asians
99.9
/100
|
#50
Exceptional
52.1%
Immigrants | Greece
99.9
/100
|
#51
Exceptional
52.1%
Bolivians
99.8
/100
|
#52
Exceptional
52.0%
Immigrants | Asia
99.8
/100
|
#53
Exceptional
52.0%
Immigrants | Spain
99.8
/100
|
#54
Exceptional
51.9%
Australians
99.8
/100
|
#55
Exceptional
51.9%
Immigrants | Czechoslovakia
99.8
/100
|
#56
Exceptional
51.9%
Paraguayans
99.8
/100
|
#57
Exceptional
51.8%
New Zealanders
99.8
/100
|
#58
Exceptional
51.8%
Immigrants | Serbia
99.8
/100
|
#59
Exceptional
51.7%
Immigrants | Bolivia
99.7
/100
|
#60
Exceptional
51.5%
Immigrants | Kazakhstan
99.7
/100
|
#61
Exceptional
51.4%
Bhutanese
99.7
/100
|
#62
Exceptional
51.4%
South Africans
99.7
/100
|
#63
Exceptional
51.4%
Immigrants | Netherlands
99.7
/100
|
#64
Exceptional
51.4%
Zimbabweans
99.7
/100
|
#65
Exceptional
51.3%
Immigrants | Europe
99.7
/100
|
#66
Exceptional
51.3%
Argentineans
99.6
/100
|
#67
Exceptional
51.2%