Immigrants from Turkey vs Spanish American Indian Associate's Degree
COMPARE
Immigrants from Turkey
Spanish American Indian
Associate's Degree
Associate's Degree Comparison
Immigrants from Turkey
Spanish American Indians
53.4%
ASSOCIATE'S DEGREE
100.0/ 100
METRIC RATING
32nd/ 347
METRIC RANK
34.9%
ASSOCIATE'S DEGREE
0.0/ 100
METRIC RATING
335th/ 347
METRIC RANK
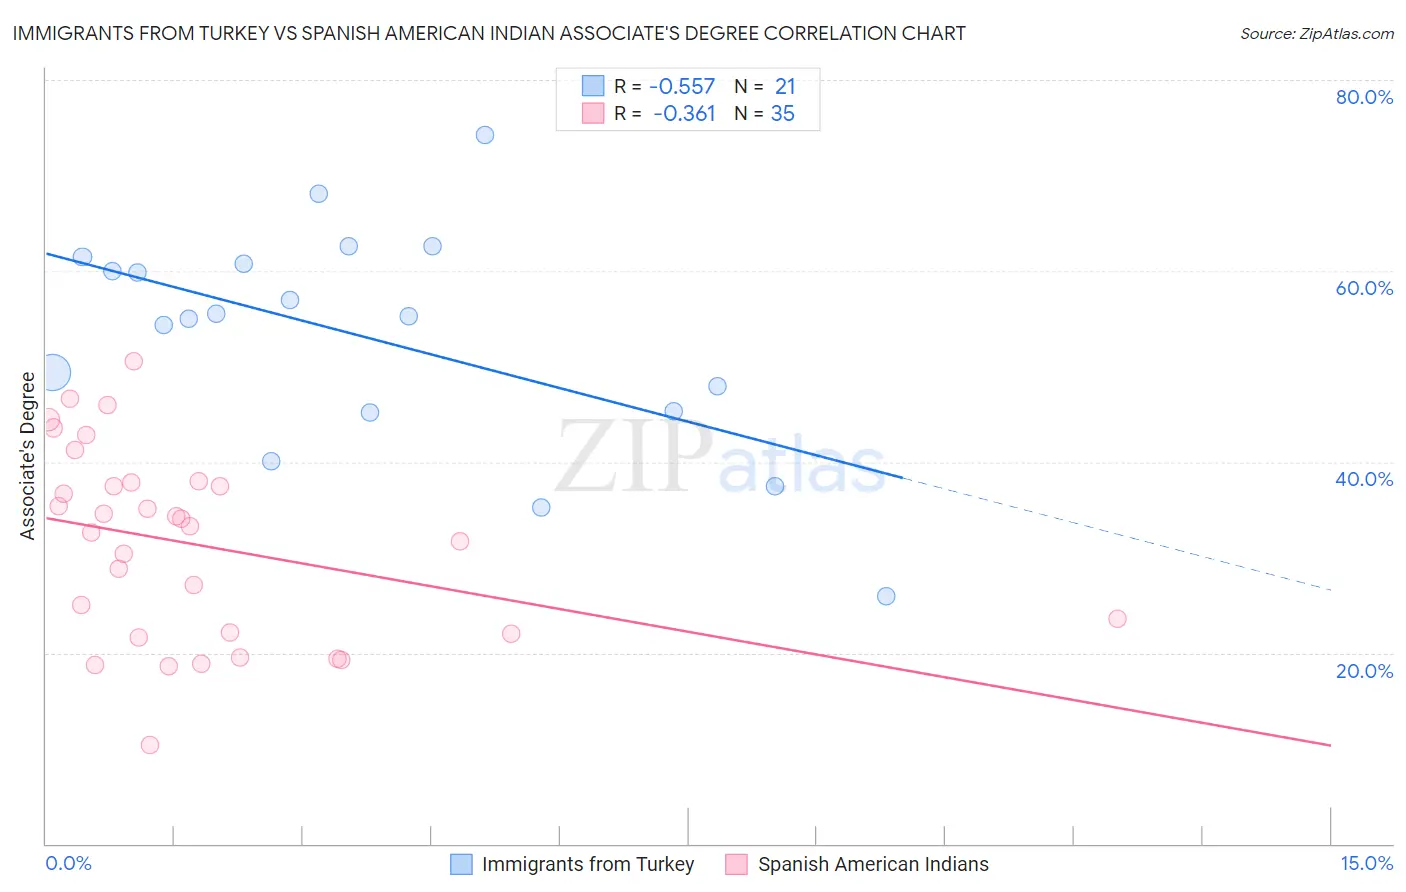
Immigrants from Turkey vs Spanish American Indian Associate's Degree Correlation Chart
The statistical analysis conducted on geographies consisting of 223,053,786 people shows a substantial negative correlation between the proportion of Immigrants from Turkey and percentage of population with at least associate's degree education in the United States with a correlation coefficient (R) of -0.557 and weighted average of 53.4%. Similarly, the statistical analysis conducted on geographies consisting of 73,150,359 people shows a mild negative correlation between the proportion of Spanish American Indians and percentage of population with at least associate's degree education in the United States with a correlation coefficient (R) of -0.361 and weighted average of 34.9%, a difference of 53.3%.
Associate's Degree Correlation Summary
| Measurement | Immigrants from Turkey | Spanish American Indian |
| Minimum | 26.0% | 10.3% |
| Maximum | 74.2% | 50.6% |
| Range | 48.2% | 40.3% |
| Mean | 53.0% | 31.4% |
| Median | 55.2% | 33.2% |
| Interquartile 25% (IQ1) | 45.2% | 22.0% |
| Interquartile 75% (IQ3) | 61.1% | 37.9% |
| Interquartile Range (IQR) | 15.9% | 15.8% |
| Standard Deviation (Sample) | 11.7% | 9.9% |
| Standard Deviation (Population) | 11.4% | 9.8% |
Similar Demographics by Associate's Degree
Demographics Similar to Immigrants from Turkey by Associate's Degree
In terms of associate's degree, the demographic groups most similar to Immigrants from Turkey are Immigrants from Northern Europe (53.5%, a difference of 0.030%), Israeli (53.4%, a difference of 0.12%), Bulgarian (53.3%, a difference of 0.31%), Russian (53.2%, a difference of 0.38%), and Immigrants from Sri Lanka (53.7%, a difference of 0.39%).
| Demographics | Rating | Rank | Associate's Degree |
| Immigrants | Switzerland | 100.0 /100 | #25 | Exceptional 54.5% |
| Immigrants | Belgium | 100.0 /100 | #26 | Exceptional 54.5% |
| Latvians | 100.0 /100 | #27 | Exceptional 53.9% |
| Turks | 100.0 /100 | #28 | Exceptional 53.9% |
| Immigrants | France | 100.0 /100 | #29 | Exceptional 53.9% |
| Immigrants | Sri Lanka | 100.0 /100 | #30 | Exceptional 53.7% |
| Immigrants | Northern Europe | 100.0 /100 | #31 | Exceptional 53.5% |
| Immigrants | Turkey | 100.0 /100 | #32 | Exceptional 53.4% |
| Israelis | 100.0 /100 | #33 | Exceptional 53.4% |
| Bulgarians | 100.0 /100 | #34 | Exceptional 53.3% |
| Russians | 100.0 /100 | #35 | Exceptional 53.2% |
| Immigrants | Russia | 100.0 /100 | #36 | Exceptional 53.1% |
| Immigrants | Denmark | 100.0 /100 | #37 | Exceptional 53.1% |
| Mongolians | 100.0 /100 | #38 | Exceptional 53.0% |
| Immigrants | Belarus | 99.9 /100 | #39 | Exceptional 52.8% |
Demographics Similar to Spanish American Indians by Associate's Degree
In terms of associate's degree, the demographic groups most similar to Spanish American Indians are Native/Alaskan (34.9%, a difference of 0.14%), Mexican (35.0%, a difference of 0.37%), Immigrants from Central America (35.0%, a difference of 0.45%), Hopi (34.6%, a difference of 0.88%), and Lumbee (34.1%, a difference of 2.2%).
| Demographics | Rating | Rank | Associate's Degree |
| Alaskan Athabascans | 0.0 /100 | #328 | Tragic 36.5% |
| Paiute | 0.0 /100 | #329 | Tragic 36.4% |
| Apache | 0.0 /100 | #330 | Tragic 36.2% |
| Immigrants | Azores | 0.0 /100 | #331 | Tragic 35.6% |
| Immigrants | Central America | 0.0 /100 | #332 | Tragic 35.0% |
| Mexicans | 0.0 /100 | #333 | Tragic 35.0% |
| Natives/Alaskans | 0.0 /100 | #334 | Tragic 34.9% |
| Spanish American Indians | 0.0 /100 | #335 | Tragic 34.9% |
| Hopi | 0.0 /100 | #336 | Tragic 34.6% |
| Lumbee | 0.0 /100 | #337 | Tragic 34.1% |
| Pueblo | 0.0 /100 | #338 | Tragic 34.0% |
| Immigrants | Mexico | 0.0 /100 | #339 | Tragic 33.7% |
| Navajo | 0.0 /100 | #340 | Tragic 32.6% |
| Inupiat | 0.0 /100 | #341 | Tragic 32.6% |
| Yakama | 0.0 /100 | #342 | Tragic 32.3% |