French vs Somali 7th Grade
COMPARE
French
Somali
7th Grade
7th Grade Comparison
French
Somalis
97.4%
7TH GRADE
100.0/ 100
METRIC RATING
25th/ 347
METRIC RANK
95.3%
7TH GRADE
0.9/ 100
METRIC RATING
253rd/ 347
METRIC RANK
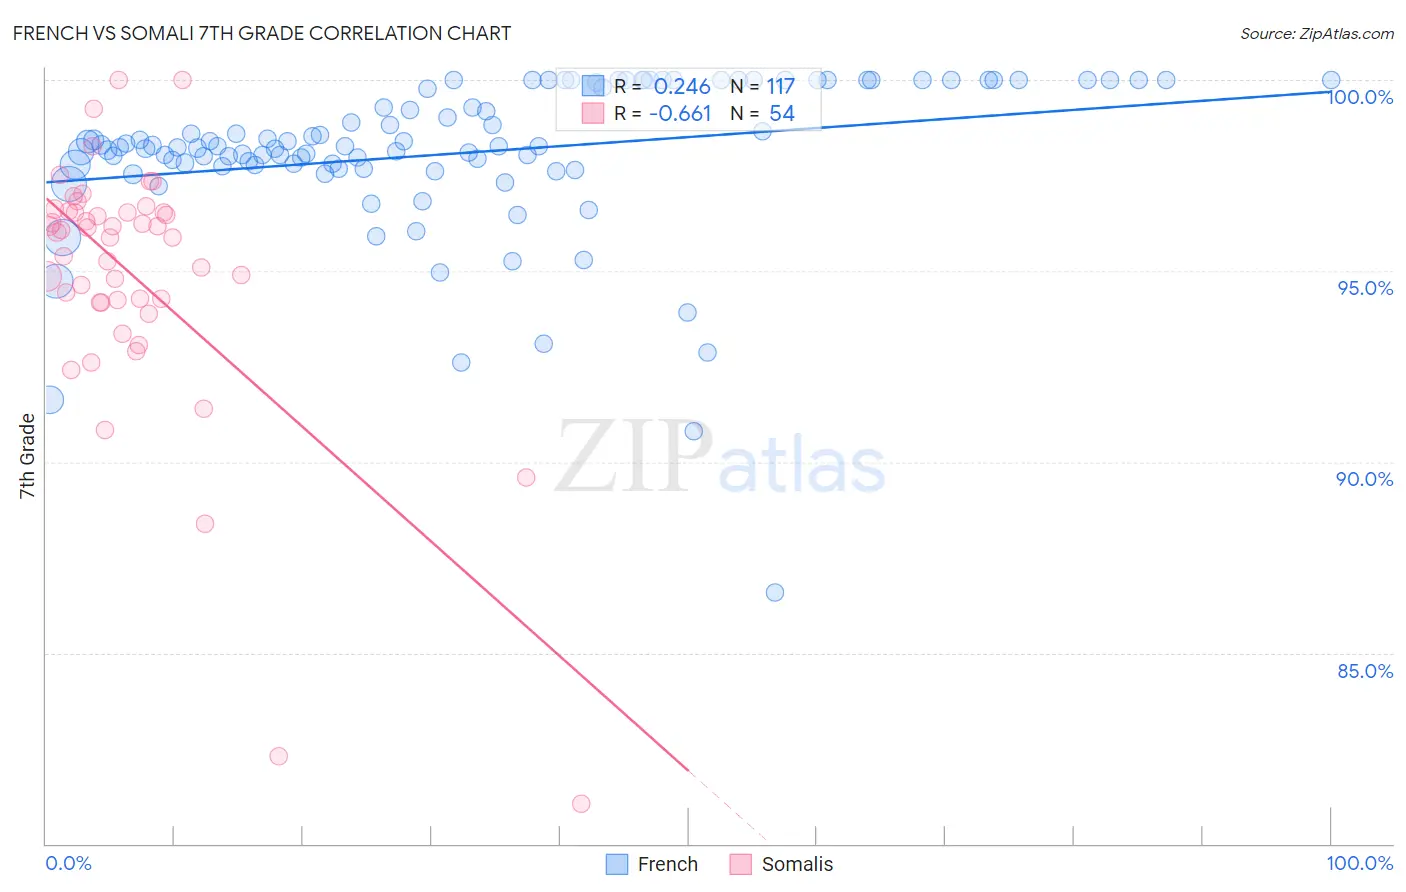
French vs Somali 7th Grade Correlation Chart
The statistical analysis conducted on geographies consisting of 572,427,255 people shows a weak positive correlation between the proportion of French and percentage of population with at least 7th grade education in the United States with a correlation coefficient (R) of 0.246 and weighted average of 97.4%. Similarly, the statistical analysis conducted on geographies consisting of 99,332,457 people shows a significant negative correlation between the proportion of Somalis and percentage of population with at least 7th grade education in the United States with a correlation coefficient (R) of -0.661 and weighted average of 95.3%, a difference of 2.2%.
7th Grade Correlation Summary
| Measurement | French | Somali |
| Minimum | 86.6% | 81.1% |
| Maximum | 100.0% | 100.0% |
| Range | 13.4% | 18.9% |
| Mean | 98.1% | 94.9% |
| Median | 98.3% | 95.9% |
| Interquartile 25% (IQ1) | 97.8% | 94.2% |
| Interquartile 75% (IQ3) | 100.0% | 96.5% |
| Interquartile Range (IQR) | 2.2% | 2.4% |
| Standard Deviation (Sample) | 2.1% | 3.4% |
| Standard Deviation (Population) | 2.1% | 3.4% |
Similar Demographics by 7th Grade
Demographics Similar to French by 7th Grade
In terms of 7th grade, the demographic groups most similar to French are Welsh (97.4%, a difference of 0.0%), Scotch-Irish (97.4%, a difference of 0.010%), Danish (97.4%, a difference of 0.010%), Croatian (97.4%, a difference of 0.020%), and French Canadian (97.4%, a difference of 0.030%).
| Demographics | Rating | Rank | 7th Grade |
| Tlingit-Haida | 100.0 /100 | #18 | Exceptional 97.5% |
| Lithuanians | 100.0 /100 | #19 | Exceptional 97.5% |
| Yup'ik | 100.0 /100 | #20 | Exceptional 97.4% |
| Inupiat | 100.0 /100 | #21 | Exceptional 97.4% |
| French Canadians | 100.0 /100 | #22 | Exceptional 97.4% |
| Croatians | 100.0 /100 | #23 | Exceptional 97.4% |
| Welsh | 100.0 /100 | #24 | Exceptional 97.4% |
| French | 100.0 /100 | #25 | Exceptional 97.4% |
| Scotch-Irish | 100.0 /100 | #26 | Exceptional 97.4% |
| Danes | 100.0 /100 | #27 | Exceptional 97.4% |
| Sioux | 100.0 /100 | #28 | Exceptional 97.4% |
| Scandinavians | 100.0 /100 | #29 | Exceptional 97.4% |
| Czechs | 100.0 /100 | #30 | Exceptional 97.4% |
| Europeans | 100.0 /100 | #31 | Exceptional 97.3% |
| Italians | 100.0 /100 | #32 | Exceptional 97.3% |
Demographics Similar to Somalis by 7th Grade
In terms of 7th grade, the demographic groups most similar to Somalis are Immigrants from Cameroon (95.4%, a difference of 0.010%), Immigrants from Jamaica (95.4%, a difference of 0.010%), Immigrants from Ethiopia (95.3%, a difference of 0.010%), Colombian (95.3%, a difference of 0.010%), and Korean (95.3%, a difference of 0.020%).
| Demographics | Rating | Rank | 7th Grade |
| Ethiopians | 1.5 /100 | #246 | Tragic 95.4% |
| Tongans | 1.3 /100 | #247 | Tragic 95.4% |
| Paiute | 1.2 /100 | #248 | Tragic 95.4% |
| Bolivians | 1.1 /100 | #249 | Tragic 95.4% |
| Immigrants | Cameroon | 0.9 /100 | #250 | Tragic 95.4% |
| Immigrants | Jamaica | 0.9 /100 | #251 | Tragic 95.4% |
| Immigrants | Ethiopia | 0.9 /100 | #252 | Tragic 95.3% |
| Somalis | 0.9 /100 | #253 | Tragic 95.3% |
| Colombians | 0.8 /100 | #254 | Tragic 95.3% |
| Koreans | 0.8 /100 | #255 | Tragic 95.3% |
| Immigrants | China | 0.7 /100 | #256 | Tragic 95.3% |
| Immigrants | Congo | 0.7 /100 | #257 | Tragic 95.3% |
| Ghanaians | 0.7 /100 | #258 | Tragic 95.3% |
| Immigrants | Costa Rica | 0.6 /100 | #259 | Tragic 95.3% |
| Afghans | 0.5 /100 | #260 | Tragic 95.3% |