Immigrants vs Lebanese Kindergarten
COMPARE
Immigrants
Lebanese
Kindergarten
Kindergarten Comparison
Immigrants
Lebanese
97.2%
KINDERGARTEN
0.0/ 100
METRIC RATING
294th/ 347
METRIC RANK
98.2%
KINDERGARTEN
93.5/ 100
METRIC RATING
126th/ 347
METRIC RANK
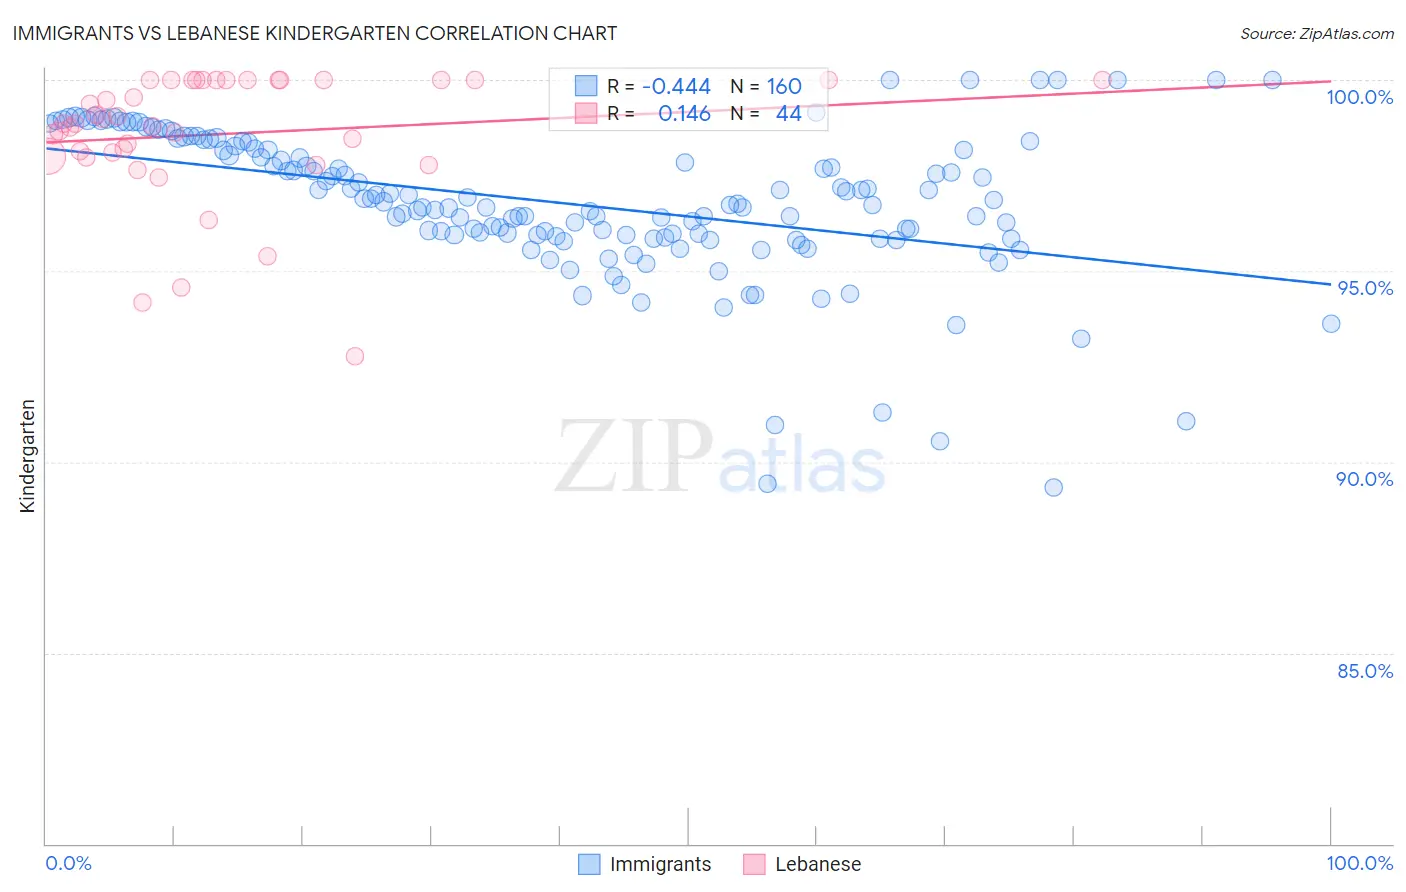
Immigrants vs Lebanese Kindergarten Correlation Chart
The statistical analysis conducted on geographies consisting of 577,788,049 people shows a moderate negative correlation between the proportion of Immigrants and percentage of population with at least kindergarten education in the United States with a correlation coefficient (R) of -0.444 and weighted average of 97.2%. Similarly, the statistical analysis conducted on geographies consisting of 401,624,157 people shows a poor positive correlation between the proportion of Lebanese and percentage of population with at least kindergarten education in the United States with a correlation coefficient (R) of 0.146 and weighted average of 98.2%, a difference of 0.97%.
Kindergarten Correlation Summary
| Measurement | Immigrants | Lebanese |
| Minimum | 89.3% | 92.8% |
| Maximum | 100.0% | 100.0% |
| Range | 10.7% | 7.2% |
| Mean | 96.8% | 98.6% |
| Median | 96.7% | 98.9% |
| Interquartile 25% (IQ1) | 95.9% | 98.1% |
| Interquartile 75% (IQ3) | 98.2% | 100.0% |
| Interquartile Range (IQR) | 2.3% | 1.9% |
| Standard Deviation (Sample) | 1.9% | 1.7% |
| Standard Deviation (Population) | 1.9% | 1.7% |
Similar Demographics by Kindergarten
Demographics Similar to Immigrants by Kindergarten
In terms of kindergarten, the demographic groups most similar to Immigrants are Immigrants from Grenada (97.2%, a difference of 0.0%), Immigrants from Eritrea (97.2%, a difference of 0.010%), Malaysian (97.2%, a difference of 0.030%), British West Indian (97.3%, a difference of 0.040%), and Houma (97.3%, a difference of 0.050%).
| Demographics | Rating | Rank | Kindergarten |
| Immigrants | Hong Kong | 0.0 /100 | #287 | Tragic 97.3% |
| Immigrants | Thailand | 0.0 /100 | #288 | Tragic 97.3% |
| Immigrants | Afghanistan | 0.0 /100 | #289 | Tragic 97.3% |
| Immigrants | St. Vincent and the Grenadines | 0.0 /100 | #290 | Tragic 97.3% |
| Houma | 0.0 /100 | #291 | Tragic 97.3% |
| British West Indians | 0.0 /100 | #292 | Tragic 97.3% |
| Malaysians | 0.0 /100 | #293 | Tragic 97.2% |
| Immigrants | Immigrants | 0.0 /100 | #294 | Tragic 97.2% |
| Immigrants | Grenada | 0.0 /100 | #295 | Tragic 97.2% |
| Immigrants | Eritrea | 0.0 /100 | #296 | Tragic 97.2% |
| Central American Indians | 0.0 /100 | #297 | Tragic 97.2% |
| Immigrants | Dominica | 0.0 /100 | #298 | Tragic 97.1% |
| Immigrants | Cuba | 0.0 /100 | #299 | Tragic 97.1% |
| Haitians | 0.0 /100 | #300 | Tragic 97.1% |
| Immigrants | South Eastern Asia | 0.0 /100 | #301 | Tragic 97.1% |
Demographics Similar to Lebanese by Kindergarten
In terms of kindergarten, the demographic groups most similar to Lebanese are Syrian (98.2%, a difference of 0.0%), Iroquois (98.2%, a difference of 0.0%), Immigrants from Saudi Arabia (98.1%, a difference of 0.0%), Okinawan (98.2%, a difference of 0.010%), and Immigrants from Zimbabwe (98.2%, a difference of 0.010%).
| Demographics | Rating | Rank | Kindergarten |
| Thais | 94.8 /100 | #119 | Exceptional 98.2% |
| Okinawans | 94.4 /100 | #120 | Exceptional 98.2% |
| Immigrants | Zimbabwe | 94.0 /100 | #121 | Exceptional 98.2% |
| Immigrants | Japan | 94.0 /100 | #122 | Exceptional 98.2% |
| Menominee | 93.9 /100 | #123 | Exceptional 98.2% |
| Syrians | 93.6 /100 | #124 | Exceptional 98.2% |
| Iroquois | 93.5 /100 | #125 | Exceptional 98.2% |
| Lebanese | 93.5 /100 | #126 | Exceptional 98.2% |
| Immigrants | Saudi Arabia | 93.1 /100 | #127 | Exceptional 98.1% |
| Immigrants | Serbia | 92.4 /100 | #128 | Exceptional 98.1% |
| Seminole | 91.5 /100 | #129 | Exceptional 98.1% |
| Immigrants | Croatia | 91.2 /100 | #130 | Exceptional 98.1% |
| Cambodians | 91.2 /100 | #131 | Exceptional 98.1% |
| Spaniards | 91.0 /100 | #132 | Exceptional 98.1% |
| Immigrants | Europe | 90.4 /100 | #133 | Exceptional 98.1% |