Immigrants vs Immigrants from Western Asia 3rd Grade
COMPARE
Immigrants
Immigrants from Western Asia
3rd Grade
3rd Grade Comparison
Immigrants
Immigrants from Western Asia
96.9%
3RD GRADE
0.0/ 100
METRIC RATING
296th/ 347
METRIC RANK
97.5%
3RD GRADE
2.6/ 100
METRIC RATING
232nd/ 347
METRIC RANK
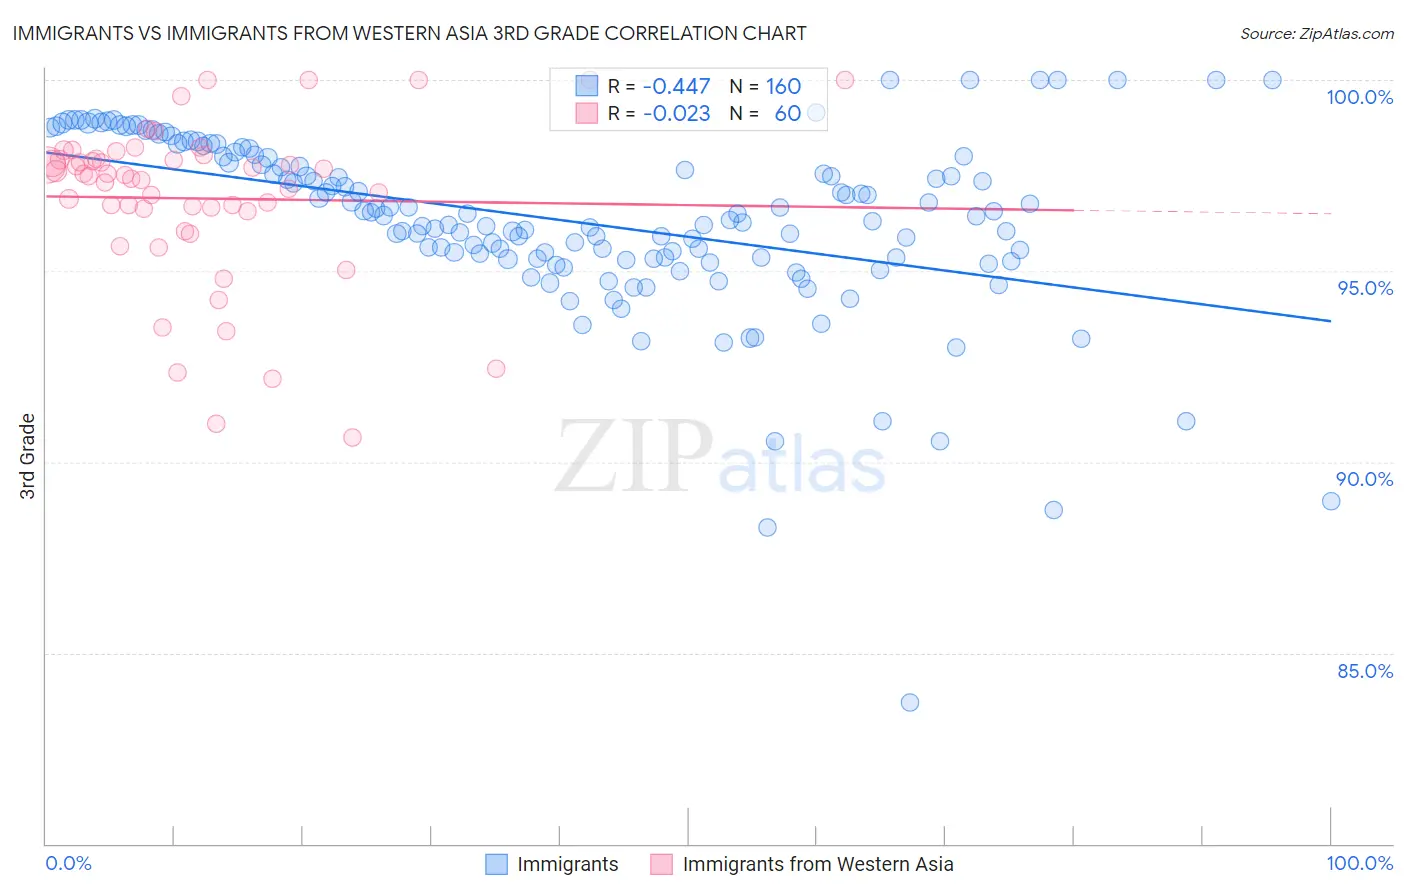
Immigrants vs Immigrants from Western Asia 3rd Grade Correlation Chart
The statistical analysis conducted on geographies consisting of 577,788,049 people shows a moderate negative correlation between the proportion of Immigrants and percentage of population with at least 3rd grade education in the United States with a correlation coefficient (R) of -0.447 and weighted average of 96.9%. Similarly, the statistical analysis conducted on geographies consisting of 404,424,892 people shows no correlation between the proportion of Immigrants from Western Asia and percentage of population with at least 3rd grade education in the United States with a correlation coefficient (R) of -0.023 and weighted average of 97.5%, a difference of 0.60%.
3rd Grade Correlation Summary
| Measurement | Immigrants | Immigrants from Western Asia |
| Minimum | 83.7% | 90.6% |
| Maximum | 100.0% | 100.0% |
| Range | 16.3% | 9.4% |
| Mean | 96.3% | 96.9% |
| Median | 96.4% | 97.5% |
| Interquartile 25% (IQ1) | 95.3% | 96.6% |
| Interquartile 75% (IQ3) | 98.0% | 97.9% |
| Interquartile Range (IQR) | 2.7% | 1.3% |
| Standard Deviation (Sample) | 2.4% | 2.1% |
| Standard Deviation (Population) | 2.4% | 2.1% |
Similar Demographics by 3rd Grade
Demographics Similar to Immigrants by 3rd Grade
In terms of 3rd grade, the demographic groups most similar to Immigrants are Haitian (96.9%, a difference of 0.020%), Immigrants from Dominica (96.9%, a difference of 0.030%), Somali (96.8%, a difference of 0.040%), Immigrants from South Eastern Asia (96.8%, a difference of 0.050%), and Immigrants from Cuba (96.8%, a difference of 0.050%).
| Demographics | Rating | Rank | 3rd Grade |
| Immigrants | Thailand | 0.0 /100 | #289 | Tragic 97.1% |
| Immigrants | Portugal | 0.0 /100 | #290 | Tragic 97.0% |
| Immigrants | Afghanistan | 0.0 /100 | #291 | Tragic 97.0% |
| British West Indians | 0.0 /100 | #292 | Tragic 97.0% |
| Immigrants | Grenada | 0.0 /100 | #293 | Tragic 97.0% |
| Malaysians | 0.0 /100 | #294 | Tragic 97.0% |
| Immigrants | Eritrea | 0.0 /100 | #295 | Tragic 97.0% |
| Immigrants | Immigrants | 0.0 /100 | #296 | Tragic 96.9% |
| Haitians | 0.0 /100 | #297 | Tragic 96.9% |
| Immigrants | Dominica | 0.0 /100 | #298 | Tragic 96.9% |
| Somalis | 0.0 /100 | #299 | Tragic 96.8% |
| Immigrants | South Eastern Asia | 0.0 /100 | #300 | Tragic 96.8% |
| Immigrants | Cuba | 0.0 /100 | #301 | Tragic 96.8% |
| Immigrants | Somalia | 0.0 /100 | #302 | Tragic 96.8% |
| Ecuadorians | 0.0 /100 | #303 | Tragic 96.7% |
Demographics Similar to Immigrants from Western Asia by 3rd Grade
In terms of 3rd grade, the demographic groups most similar to Immigrants from Western Asia are Immigrants from Costa Rica (97.5%, a difference of 0.0%), Immigrants from Malaysia (97.5%, a difference of 0.0%), Senegalese (97.5%, a difference of 0.010%), Immigrants from Pakistan (97.5%, a difference of 0.010%), and Subsaharan African (97.5%, a difference of 0.020%).
| Demographics | Rating | Rank | 3rd Grade |
| Tongans | 4.3 /100 | #225 | Tragic 97.5% |
| Sudanese | 4.1 /100 | #226 | Tragic 97.5% |
| Immigrants | Sudan | 3.4 /100 | #227 | Tragic 97.5% |
| Sub-Saharan Africans | 3.2 /100 | #228 | Tragic 97.5% |
| Senegalese | 3.0 /100 | #229 | Tragic 97.5% |
| Immigrants | Pakistan | 2.7 /100 | #230 | Tragic 97.5% |
| Immigrants | Costa Rica | 2.7 /100 | #231 | Tragic 97.5% |
| Immigrants | Western Asia | 2.6 /100 | #232 | Tragic 97.5% |
| Immigrants | Malaysia | 2.4 /100 | #233 | Tragic 97.5% |
| Immigrants | Eastern Asia | 1.9 /100 | #234 | Tragic 97.4% |
| Immigrants | Iraq | 1.8 /100 | #235 | Tragic 97.4% |
| Liberians | 1.8 /100 | #236 | Tragic 97.4% |
| Colombians | 1.8 /100 | #237 | Tragic 97.4% |
| Immigrants | Uruguay | 1.7 /100 | #238 | Tragic 97.4% |
| Nigerians | 1.6 /100 | #239 | Tragic 97.4% |