Arapaho vs Immigrants from Western Asia 3rd Grade
COMPARE
Arapaho
Immigrants from Western Asia
3rd Grade
3rd Grade Comparison
Arapaho
Immigrants from Western Asia
98.4%
3RD GRADE
100.0/ 100
METRIC RATING
35th/ 347
METRIC RANK
97.5%
3RD GRADE
2.6/ 100
METRIC RATING
232nd/ 347
METRIC RANK
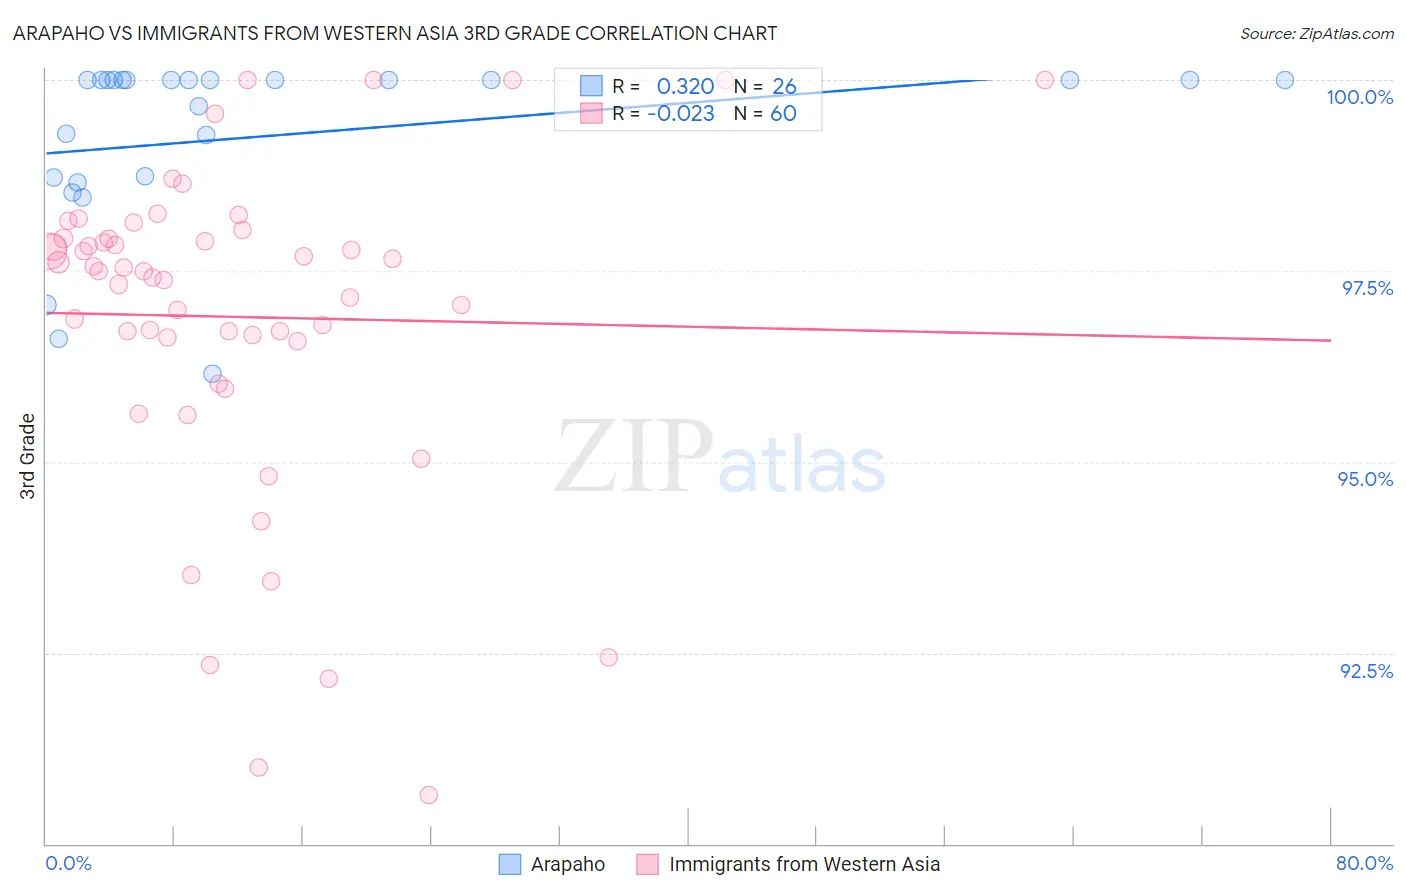
Arapaho vs Immigrants from Western Asia 3rd Grade Correlation Chart
The statistical analysis conducted on geographies consisting of 29,780,295 people shows a mild positive correlation between the proportion of Arapaho and percentage of population with at least 3rd grade education in the United States with a correlation coefficient (R) of 0.320 and weighted average of 98.4%. Similarly, the statistical analysis conducted on geographies consisting of 404,424,892 people shows no correlation between the proportion of Immigrants from Western Asia and percentage of population with at least 3rd grade education in the United States with a correlation coefficient (R) of -0.023 and weighted average of 97.5%, a difference of 0.96%.
3rd Grade Correlation Summary
| Measurement | Arapaho | Immigrants from Western Asia |
| Minimum | 96.2% | 90.6% |
| Maximum | 100.0% | 100.0% |
| Range | 3.8% | 9.4% |
| Mean | 99.3% | 96.9% |
| Median | 100.0% | 97.5% |
| Interquartile 25% (IQ1) | 98.7% | 96.6% |
| Interquartile 75% (IQ3) | 100.0% | 97.9% |
| Interquartile Range (IQR) | 1.3% | 1.3% |
| Standard Deviation (Sample) | 1.1% | 2.1% |
| Standard Deviation (Population) | 1.1% | 2.1% |
Similar Demographics by 3rd Grade
Demographics Similar to Arapaho by 3rd Grade
In terms of 3rd grade, the demographic groups most similar to Arapaho are Swiss (98.4%, a difference of 0.010%), British (98.4%, a difference of 0.010%), Chinese (98.4%, a difference of 0.020%), Italian (98.4%, a difference of 0.020%), and Chippewa (98.4%, a difference of 0.020%).
| Demographics | Rating | Rank | 3rd Grade |
| French | 100.0 /100 | #28 | Exceptional 98.4% |
| French Canadians | 100.0 /100 | #29 | Exceptional 98.4% |
| Europeans | 100.0 /100 | #30 | Exceptional 98.4% |
| Czechs | 100.0 /100 | #31 | Exceptional 98.4% |
| Scandinavians | 100.0 /100 | #32 | Exceptional 98.4% |
| Chinese | 100.0 /100 | #33 | Exceptional 98.4% |
| Swiss | 100.0 /100 | #34 | Exceptional 98.4% |
| Arapaho | 100.0 /100 | #35 | Exceptional 98.4% |
| British | 99.9 /100 | #36 | Exceptional 98.4% |
| Italians | 99.9 /100 | #37 | Exceptional 98.4% |
| Chippewa | 99.9 /100 | #38 | Exceptional 98.4% |
| Latvians | 99.9 /100 | #39 | Exceptional 98.4% |
| Eastern Europeans | 99.9 /100 | #40 | Exceptional 98.3% |
| Luxembourgers | 99.9 /100 | #41 | Exceptional 98.3% |
| Belgians | 99.9 /100 | #42 | Exceptional 98.3% |
Demographics Similar to Immigrants from Western Asia by 3rd Grade
In terms of 3rd grade, the demographic groups most similar to Immigrants from Western Asia are Immigrants from Costa Rica (97.5%, a difference of 0.0%), Immigrants from Malaysia (97.5%, a difference of 0.0%), Senegalese (97.5%, a difference of 0.010%), Immigrants from Pakistan (97.5%, a difference of 0.010%), and Subsaharan African (97.5%, a difference of 0.020%).
| Demographics | Rating | Rank | 3rd Grade |
| Tongans | 4.3 /100 | #225 | Tragic 97.5% |
| Sudanese | 4.1 /100 | #226 | Tragic 97.5% |
| Immigrants | Sudan | 3.4 /100 | #227 | Tragic 97.5% |
| Sub-Saharan Africans | 3.2 /100 | #228 | Tragic 97.5% |
| Senegalese | 3.0 /100 | #229 | Tragic 97.5% |
| Immigrants | Pakistan | 2.7 /100 | #230 | Tragic 97.5% |
| Immigrants | Costa Rica | 2.7 /100 | #231 | Tragic 97.5% |
| Immigrants | Western Asia | 2.6 /100 | #232 | Tragic 97.5% |
| Immigrants | Malaysia | 2.4 /100 | #233 | Tragic 97.5% |
| Immigrants | Eastern Asia | 1.9 /100 | #234 | Tragic 97.4% |
| Immigrants | Iraq | 1.8 /100 | #235 | Tragic 97.4% |
| Liberians | 1.8 /100 | #236 | Tragic 97.4% |
| Colombians | 1.8 /100 | #237 | Tragic 97.4% |
| Immigrants | Uruguay | 1.7 /100 | #238 | Tragic 97.4% |
| Nigerians | 1.6 /100 | #239 | Tragic 97.4% |