Immigrants from Jordan vs Immigrants from Western Asia 3rd Grade
COMPARE
Immigrants from Jordan
Immigrants from Western Asia
3rd Grade
3rd Grade Comparison
Immigrants from Jordan
Immigrants from Western Asia
97.8%
3RD GRADE
57.9/ 100
METRIC RATING
162nd/ 347
METRIC RANK
97.5%
3RD GRADE
2.6/ 100
METRIC RATING
232nd/ 347
METRIC RANK
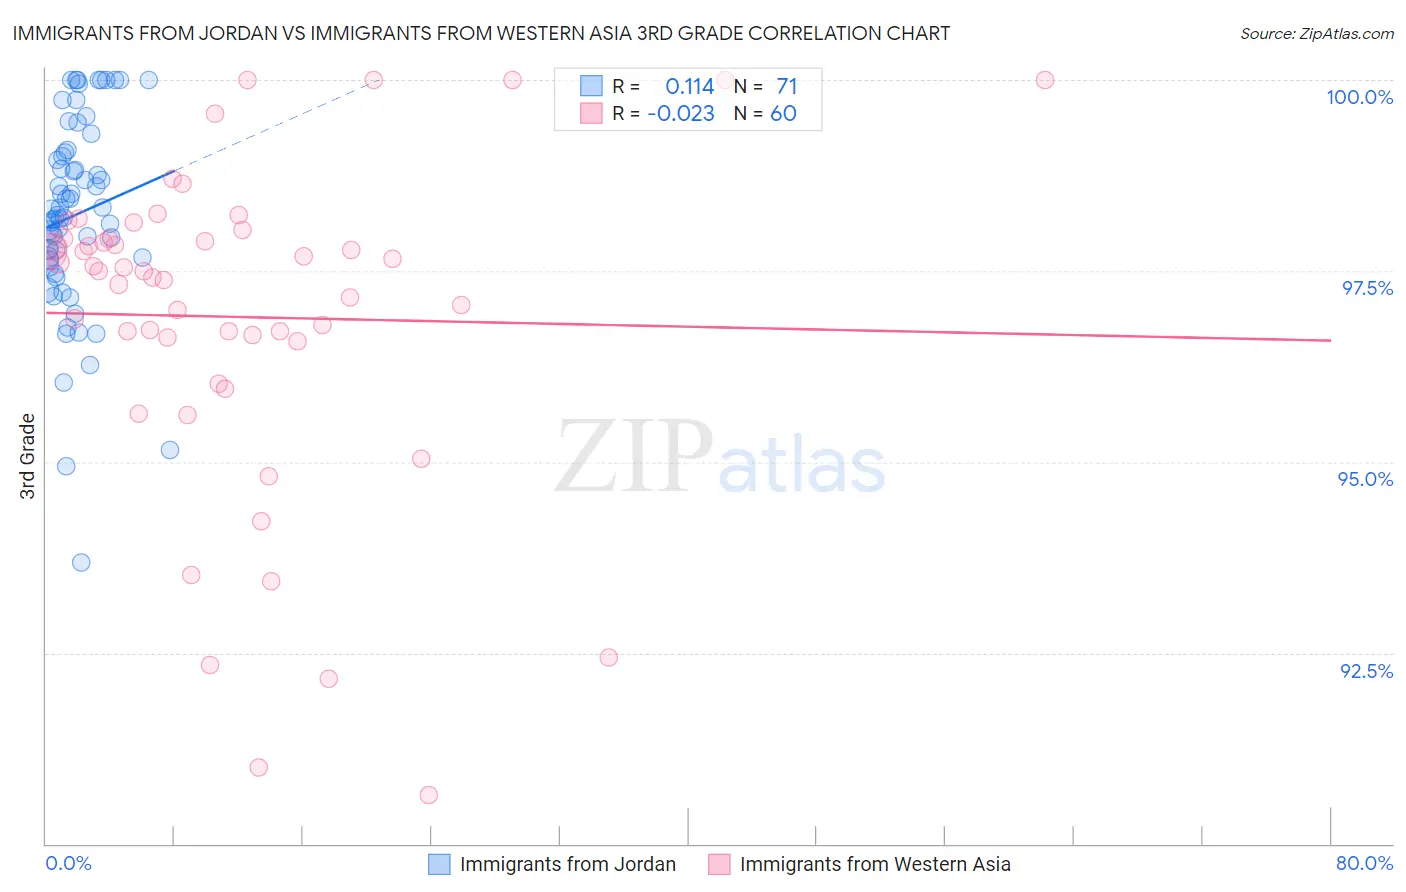
Immigrants from Jordan vs Immigrants from Western Asia 3rd Grade Correlation Chart
The statistical analysis conducted on geographies consisting of 181,269,915 people shows a poor positive correlation between the proportion of Immigrants from Jordan and percentage of population with at least 3rd grade education in the United States with a correlation coefficient (R) of 0.114 and weighted average of 97.8%. Similarly, the statistical analysis conducted on geographies consisting of 404,424,892 people shows no correlation between the proportion of Immigrants from Western Asia and percentage of population with at least 3rd grade education in the United States with a correlation coefficient (R) of -0.023 and weighted average of 97.5%, a difference of 0.34%.
3rd Grade Correlation Summary
| Measurement | Immigrants from Jordan | Immigrants from Western Asia |
| Minimum | 93.7% | 90.6% |
| Maximum | 100.0% | 100.0% |
| Range | 6.3% | 9.4% |
| Mean | 98.2% | 96.9% |
| Median | 98.2% | 97.5% |
| Interquartile 25% (IQ1) | 97.6% | 96.6% |
| Interquartile 75% (IQ3) | 99.1% | 97.9% |
| Interquartile Range (IQR) | 1.4% | 1.3% |
| Standard Deviation (Sample) | 1.3% | 2.1% |
| Standard Deviation (Population) | 1.3% | 2.1% |
Similar Demographics by 3rd Grade
Demographics Similar to Immigrants from Jordan by 3rd Grade
In terms of 3rd grade, the demographic groups most similar to Immigrants from Jordan are Immigrants from Iran (97.8%, a difference of 0.0%), Albanian (97.8%, a difference of 0.0%), Marshallese (97.8%, a difference of 0.0%), Immigrants from Russia (97.8%, a difference of 0.010%), and Immigrants from Italy (97.8%, a difference of 0.010%).
| Demographics | Rating | Rank | 3rd Grade |
| Bermudans | 62.6 /100 | #155 | Good 97.8% |
| Immigrants | Russia | 61.7 /100 | #156 | Good 97.8% |
| Immigrants | Italy | 61.2 /100 | #157 | Good 97.8% |
| Venezuelans | 60.9 /100 | #158 | Good 97.8% |
| French American Indians | 60.0 /100 | #159 | Average 97.8% |
| Immigrants | Iran | 59.1 /100 | #160 | Average 97.8% |
| Albanians | 58.8 /100 | #161 | Average 97.8% |
| Immigrants | Jordan | 57.9 /100 | #162 | Average 97.8% |
| Marshallese | 57.2 /100 | #163 | Average 97.8% |
| Immigrants | Bosnia and Herzegovina | 56.2 /100 | #164 | Average 97.8% |
| Ugandans | 56.1 /100 | #165 | Average 97.8% |
| Dutch West Indians | 55.5 /100 | #166 | Average 97.8% |
| Chileans | 55.3 /100 | #167 | Average 97.8% |
| Immigrants | Spain | 54.3 /100 | #168 | Average 97.8% |
| Comanche | 53.8 /100 | #169 | Average 97.8% |
Demographics Similar to Immigrants from Western Asia by 3rd Grade
In terms of 3rd grade, the demographic groups most similar to Immigrants from Western Asia are Immigrants from Costa Rica (97.5%, a difference of 0.0%), Immigrants from Malaysia (97.5%, a difference of 0.0%), Senegalese (97.5%, a difference of 0.010%), Immigrants from Pakistan (97.5%, a difference of 0.010%), and Subsaharan African (97.5%, a difference of 0.020%).
| Demographics | Rating | Rank | 3rd Grade |
| Tongans | 4.3 /100 | #225 | Tragic 97.5% |
| Sudanese | 4.1 /100 | #226 | Tragic 97.5% |
| Immigrants | Sudan | 3.4 /100 | #227 | Tragic 97.5% |
| Sub-Saharan Africans | 3.2 /100 | #228 | Tragic 97.5% |
| Senegalese | 3.0 /100 | #229 | Tragic 97.5% |
| Immigrants | Pakistan | 2.7 /100 | #230 | Tragic 97.5% |
| Immigrants | Costa Rica | 2.7 /100 | #231 | Tragic 97.5% |
| Immigrants | Western Asia | 2.6 /100 | #232 | Tragic 97.5% |
| Immigrants | Malaysia | 2.4 /100 | #233 | Tragic 97.5% |
| Immigrants | Eastern Asia | 1.9 /100 | #234 | Tragic 97.4% |
| Immigrants | Iraq | 1.8 /100 | #235 | Tragic 97.4% |
| Liberians | 1.8 /100 | #236 | Tragic 97.4% |
| Colombians | 1.8 /100 | #237 | Tragic 97.4% |
| Immigrants | Uruguay | 1.7 /100 | #238 | Tragic 97.4% |
| Nigerians | 1.6 /100 | #239 | Tragic 97.4% |