Immigrants vs Slovene Professional Degree
COMPARE
Immigrants
Slovene
Professional Degree
Professional Degree Comparison
Immigrants
Slovenes
4.4%
PROFESSIONAL DEGREE
43.2/ 100
METRIC RATING
182nd/ 347
METRIC RANK
4.6%
PROFESSIONAL DEGREE
76.1/ 100
METRIC RATING
148th/ 347
METRIC RANK
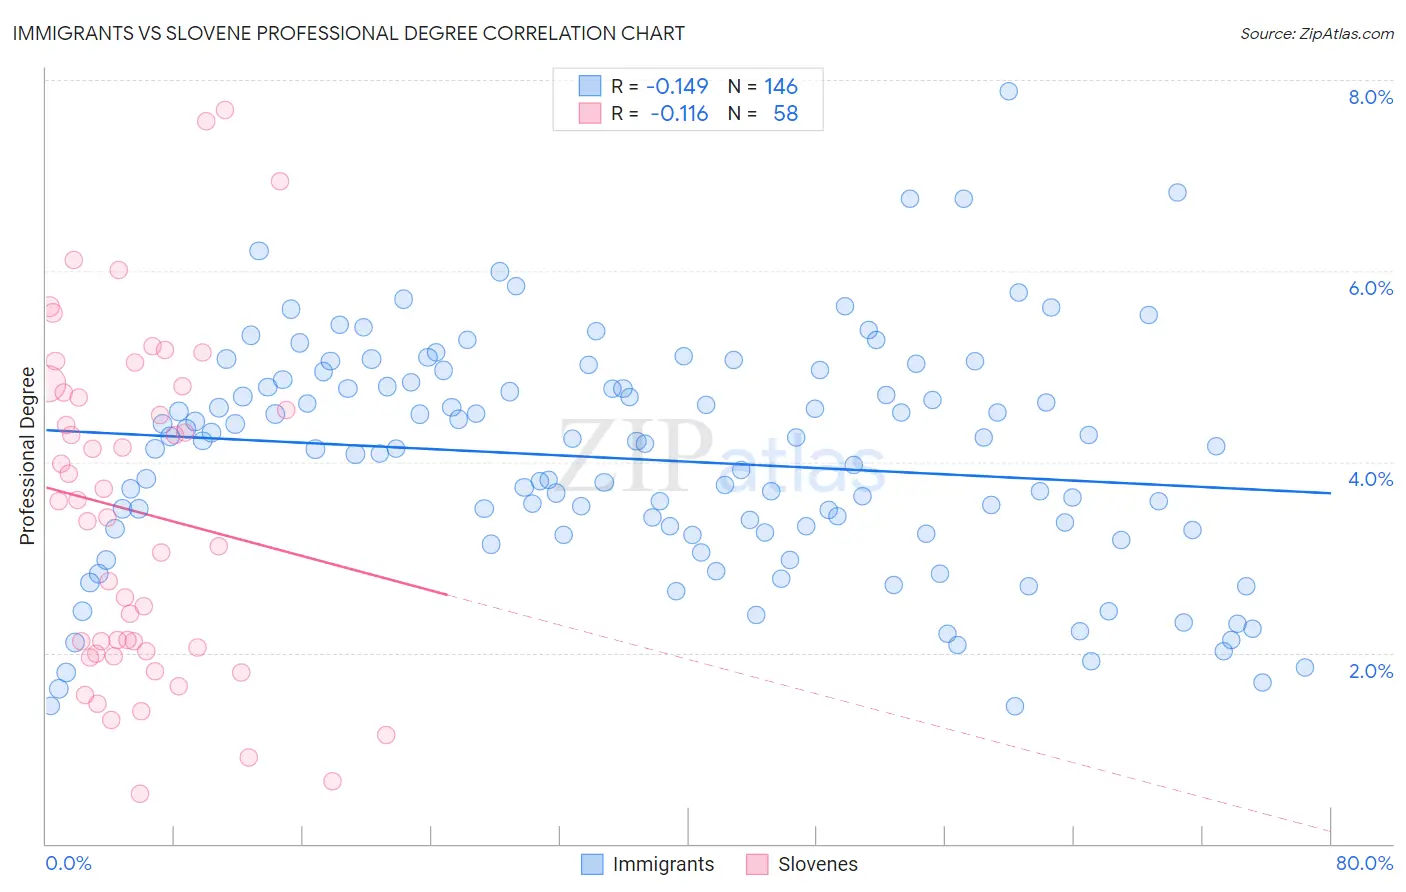
Immigrants vs Slovene Professional Degree Correlation Chart
The statistical analysis conducted on geographies consisting of 568,546,540 people shows a poor negative correlation between the proportion of Immigrants and percentage of population with at least professional degree education in the United States with a correlation coefficient (R) of -0.149 and weighted average of 4.4%. Similarly, the statistical analysis conducted on geographies consisting of 260,948,724 people shows a poor negative correlation between the proportion of Slovenes and percentage of population with at least professional degree education in the United States with a correlation coefficient (R) of -0.116 and weighted average of 4.6%, a difference of 5.2%.
Professional Degree Correlation Summary
| Measurement | Immigrants | Slovene |
| Minimum | 1.4% | 0.52% |
| Maximum | 7.9% | 7.7% |
| Range | 6.4% | 7.2% |
| Mean | 4.0% | 3.5% |
| Median | 4.1% | 3.5% |
| Interquartile 25% (IQ1) | 3.3% | 2.0% |
| Interquartile 75% (IQ3) | 4.8% | 4.7% |
| Interquartile Range (IQR) | 1.5% | 2.7% |
| Standard Deviation (Sample) | 1.2% | 1.7% |
| Standard Deviation (Population) | 1.2% | 1.7% |
Similar Demographics by Professional Degree
Demographics Similar to Immigrants by Professional Degree
In terms of professional degree, the demographic groups most similar to Immigrants are Bermudan (4.4%, a difference of 0.010%), Danish (4.4%, a difference of 0.040%), Czech (4.4%, a difference of 0.26%), Immigrants from Kenya (4.4%, a difference of 0.41%), and Immigrants from Costa Rica (4.4%, a difference of 0.52%).
| Demographics | Rating | Rank | Professional Degree |
| Irish | 50.0 /100 | #175 | Average 4.4% |
| Immigrants | Peru | 49.3 /100 | #176 | Average 4.4% |
| Celtics | 47.6 /100 | #177 | Average 4.4% |
| Immigrants | Costa Rica | 46.7 /100 | #178 | Average 4.4% |
| Immigrants | Kenya | 45.9 /100 | #179 | Average 4.4% |
| Czechs | 44.9 /100 | #180 | Average 4.4% |
| Danes | 43.5 /100 | #181 | Average 4.4% |
| Immigrants | Immigrants | 43.2 /100 | #182 | Average 4.4% |
| Bermudans | 43.1 /100 | #183 | Average 4.4% |
| Belgians | 36.2 /100 | #184 | Fair 4.3% |
| Welsh | 35.8 /100 | #185 | Fair 4.3% |
| Scotch-Irish | 34.2 /100 | #186 | Fair 4.3% |
| Immigrants | Cameroon | 33.3 /100 | #187 | Fair 4.3% |
| Immigrants | Thailand | 31.7 /100 | #188 | Fair 4.3% |
| Slovaks | 30.7 /100 | #189 | Fair 4.3% |
Demographics Similar to Slovenes by Professional Degree
In terms of professional degree, the demographic groups most similar to Slovenes are Senegalese (4.6%, a difference of 0.14%), Colombian (4.6%, a difference of 0.32%), Immigrants from Oceania (4.6%, a difference of 0.50%), Luxembourger (4.6%, a difference of 0.53%), and Polish (4.6%, a difference of 0.64%).
| Demographics | Rating | Rank | Professional Degree |
| Basques | 81.8 /100 | #141 | Excellent 4.6% |
| Sudanese | 81.3 /100 | #142 | Excellent 4.6% |
| Hungarians | 80.8 /100 | #143 | Excellent 4.6% |
| Immigrants | South America | 80.5 /100 | #144 | Excellent 4.6% |
| Uruguayans | 80.2 /100 | #145 | Excellent 4.6% |
| Luxembourgers | 78.7 /100 | #146 | Good 4.6% |
| Colombians | 77.7 /100 | #147 | Good 4.6% |
| Slovenes | 76.1 /100 | #148 | Good 4.6% |
| Senegalese | 75.3 /100 | #149 | Good 4.6% |
| Immigrants | Oceania | 73.4 /100 | #150 | Good 4.6% |
| Poles | 72.6 /100 | #151 | Good 4.6% |
| Immigrants | Africa | 72.5 /100 | #152 | Good 4.6% |
| Immigrants | Uruguay | 72.5 /100 | #153 | Good 4.6% |
| Scottish | 71.8 /100 | #154 | Good 4.6% |
| Slavs | 70.8 /100 | #155 | Good 4.5% |