Immigrants vs Lithuanian 5th Grade
COMPARE
Immigrants
Lithuanian
5th Grade
5th Grade Comparison
Immigrants
Lithuanians
96.2%
5TH GRADE
0.0/ 100
METRIC RATING
299th/ 347
METRIC RANK
98.2%
5TH GRADE
100.0/ 100
METRIC RATING
20th/ 347
METRIC RANK
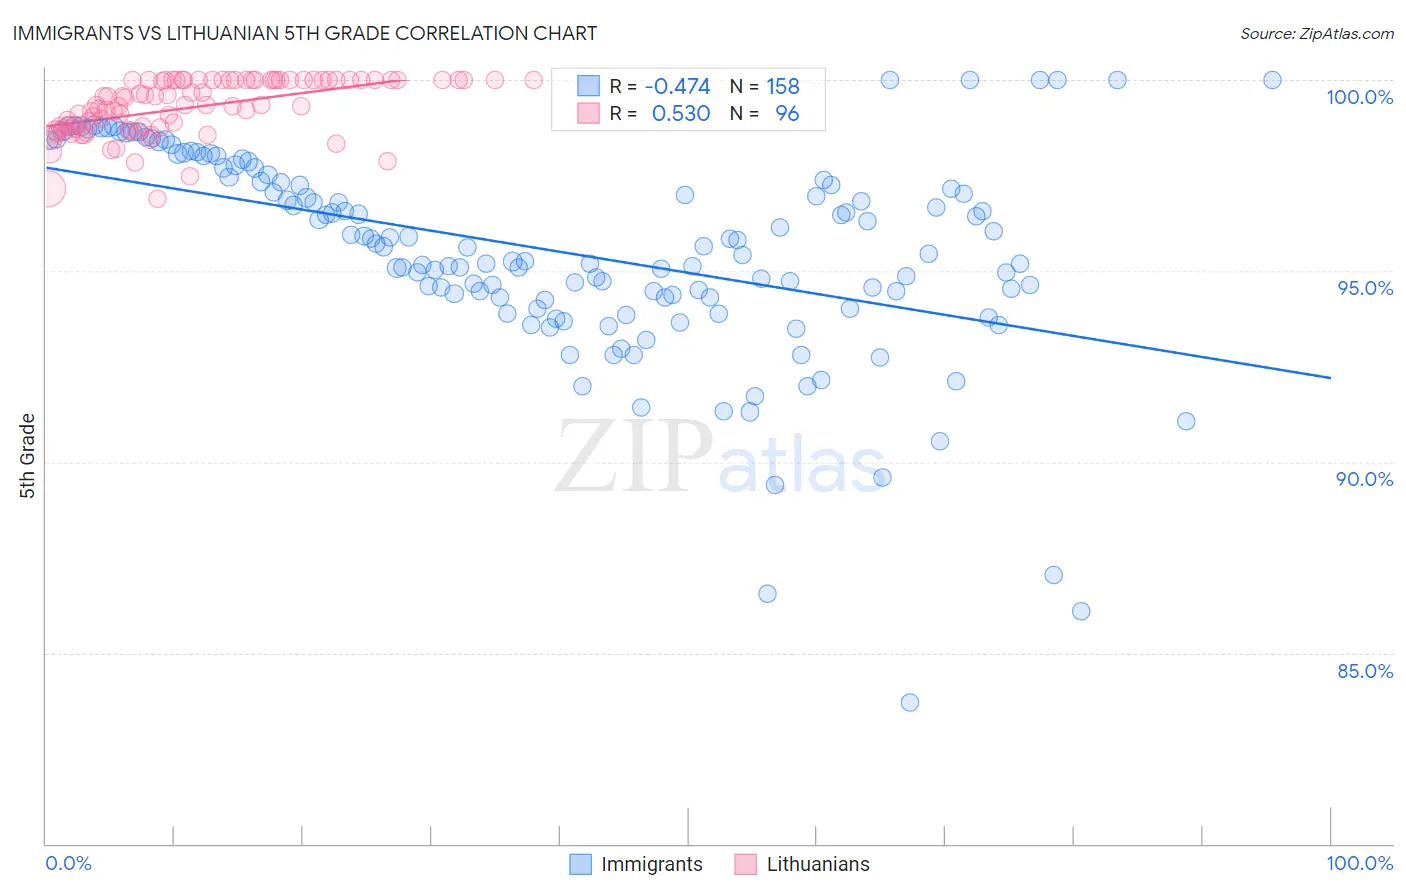
Immigrants vs Lithuanian 5th Grade Correlation Chart
The statistical analysis conducted on geographies consisting of 577,786,867 people shows a moderate negative correlation between the proportion of Immigrants and percentage of population with at least 5th grade education in the United States with a correlation coefficient (R) of -0.474 and weighted average of 96.2%. Similarly, the statistical analysis conducted on geographies consisting of 421,946,672 people shows a substantial positive correlation between the proportion of Lithuanians and percentage of population with at least 5th grade education in the United States with a correlation coefficient (R) of 0.530 and weighted average of 98.2%, a difference of 2.1%.
5th Grade Correlation Summary
| Measurement | Immigrants | Lithuanian |
| Minimum | 83.7% | 96.9% |
| Maximum | 100.0% | 100.0% |
| Range | 16.3% | 3.1% |
| Mean | 95.5% | 99.3% |
| Median | 95.6% | 99.3% |
| Interquartile 25% (IQ1) | 94.3% | 98.7% |
| Interquartile 75% (IQ3) | 97.5% | 100.0% |
| Interquartile Range (IQR) | 3.2% | 1.3% |
| Standard Deviation (Sample) | 2.7% | 0.73% |
| Standard Deviation (Population) | 2.7% | 0.73% |
Similar Demographics by 5th Grade
Demographics Similar to Immigrants by 5th Grade
In terms of 5th grade, the demographic groups most similar to Immigrants are Immigrants from Dominica (96.2%, a difference of 0.030%), Sri Lankan (96.1%, a difference of 0.050%), Immigrants from Cuba (96.1%, a difference of 0.070%), Haitian (96.3%, a difference of 0.080%), and Guyanese (96.1%, a difference of 0.080%).
| Demographics | Rating | Rank | 5th Grade |
| Somalis | 0.0 /100 | #292 | Tragic 96.5% |
| Immigrants | Grenada | 0.0 /100 | #293 | Tragic 96.5% |
| Immigrants | Eritrea | 0.0 /100 | #294 | Tragic 96.4% |
| Immigrants | Somalia | 0.0 /100 | #295 | Tragic 96.4% |
| Immigrants | South Eastern Asia | 0.0 /100 | #296 | Tragic 96.3% |
| Haitians | 0.0 /100 | #297 | Tragic 96.3% |
| Immigrants | Dominica | 0.0 /100 | #298 | Tragic 96.2% |
| Immigrants | Immigrants | 0.0 /100 | #299 | Tragic 96.2% |
| Sri Lankans | 0.0 /100 | #300 | Tragic 96.1% |
| Immigrants | Cuba | 0.0 /100 | #301 | Tragic 96.1% |
| Guyanese | 0.0 /100 | #302 | Tragic 96.1% |
| Puerto Ricans | 0.0 /100 | #303 | Tragic 96.1% |
| Immigrants | Burma/Myanmar | 0.0 /100 | #304 | Tragic 96.1% |
| Immigrants | Laos | 0.0 /100 | #305 | Tragic 96.0% |
| Immigrants | Haiti | 0.0 /100 | #306 | Tragic 96.0% |
Demographics Similar to Lithuanians by 5th Grade
In terms of 5th grade, the demographic groups most similar to Lithuanians are Finnish (98.2%, a difference of 0.0%), Pennsylvania German (98.3%, a difference of 0.010%), Polish (98.3%, a difference of 0.020%), Irish (98.3%, a difference of 0.020%), and Danish (98.2%, a difference of 0.020%).
| Demographics | Rating | Rank | 5th Grade |
| Tlingit-Haida | 100.0 /100 | #13 | Exceptional 98.3% |
| Dutch | 100.0 /100 | #14 | Exceptional 98.3% |
| Scottish | 100.0 /100 | #15 | Exceptional 98.3% |
| Poles | 100.0 /100 | #16 | Exceptional 98.3% |
| Irish | 100.0 /100 | #17 | Exceptional 98.3% |
| Pennsylvania Germans | 100.0 /100 | #18 | Exceptional 98.3% |
| Finns | 100.0 /100 | #19 | Exceptional 98.2% |
| Lithuanians | 100.0 /100 | #20 | Exceptional 98.2% |
| Danes | 100.0 /100 | #21 | Exceptional 98.2% |
| Croatians | 100.0 /100 | #22 | Exceptional 98.2% |
| Sioux | 100.0 /100 | #23 | Exceptional 98.2% |
| Scotch-Irish | 100.0 /100 | #24 | Exceptional 98.2% |
| Yup'ik | 100.0 /100 | #25 | Exceptional 98.2% |
| Alaska Natives | 100.0 /100 | #26 | Exceptional 98.2% |
| French | 100.0 /100 | #27 | Exceptional 98.2% |