Immigrants from Zimbabwe vs Bhutanese 5th Grade
COMPARE
Immigrants from Zimbabwe
Bhutanese
5th Grade
5th Grade Comparison
Immigrants from Zimbabwe
Bhutanese
97.6%
5TH GRADE
94.9/ 100
METRIC RATING
120th/ 347
METRIC RANK
97.7%
5TH GRADE
97.6/ 100
METRIC RATING
105th/ 347
METRIC RANK
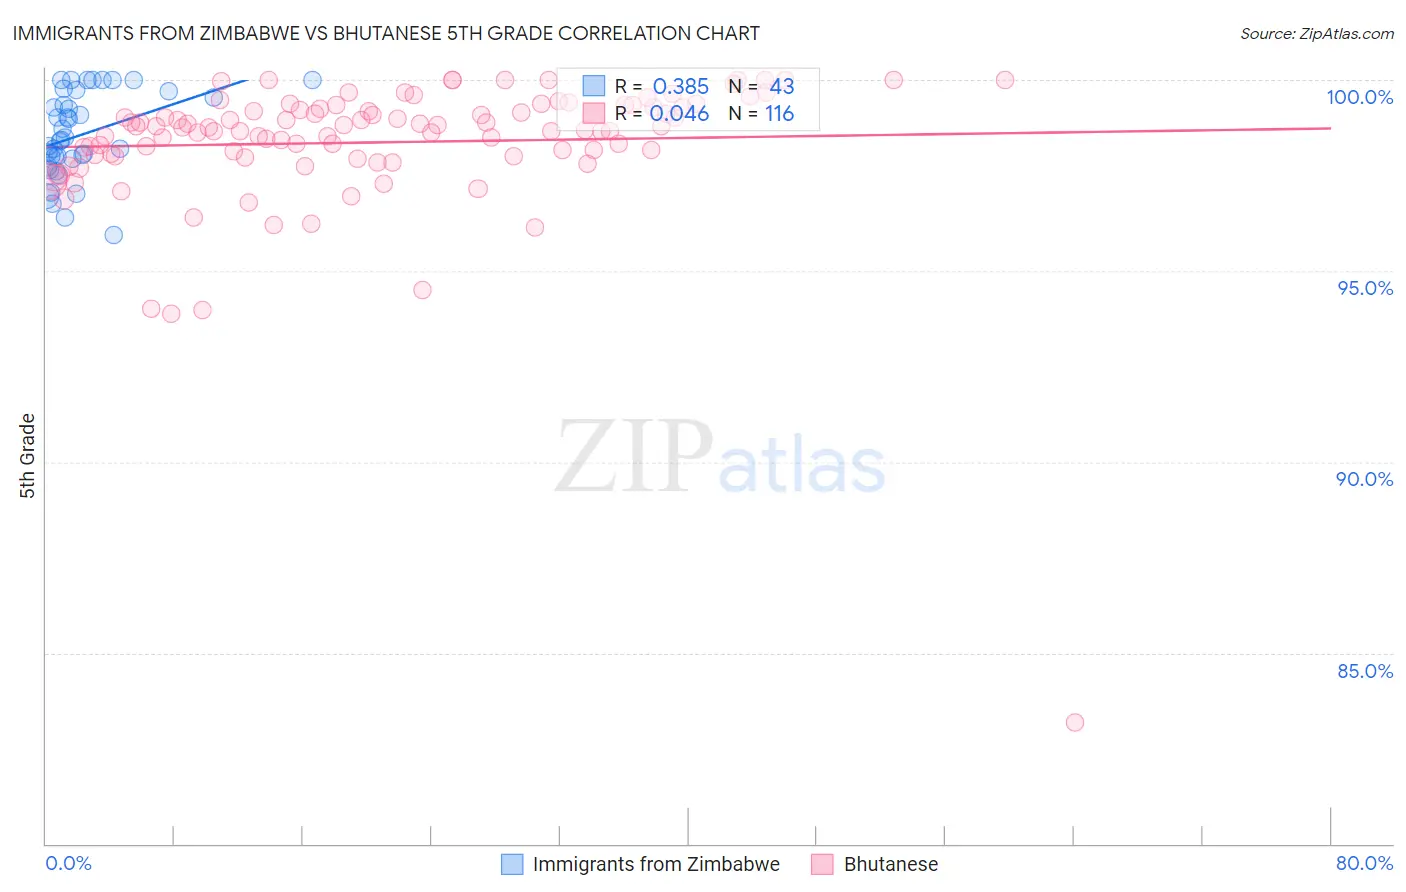
Immigrants from Zimbabwe vs Bhutanese 5th Grade Correlation Chart
The statistical analysis conducted on geographies consisting of 117,756,150 people shows a mild positive correlation between the proportion of Immigrants from Zimbabwe and percentage of population with at least 5th grade education in the United States with a correlation coefficient (R) of 0.385 and weighted average of 97.6%. Similarly, the statistical analysis conducted on geographies consisting of 455,591,134 people shows no correlation between the proportion of Bhutanese and percentage of population with at least 5th grade education in the United States with a correlation coefficient (R) of 0.046 and weighted average of 97.7%, a difference of 0.080%.
5th Grade Correlation Summary
| Measurement | Immigrants from Zimbabwe | Bhutanese |
| Minimum | 95.9% | 83.2% |
| Maximum | 100.0% | 100.0% |
| Range | 4.1% | 16.8% |
| Mean | 98.6% | 98.4% |
| Median | 98.4% | 98.7% |
| Interquartile 25% (IQ1) | 98.0% | 98.0% |
| Interquartile 75% (IQ3) | 99.7% | 99.3% |
| Interquartile Range (IQR) | 1.7% | 1.3% |
| Standard Deviation (Sample) | 1.1% | 1.9% |
| Standard Deviation (Population) | 1.1% | 1.9% |
Demographics Similar to Immigrants from Zimbabwe and Bhutanese by 5th Grade
In terms of 5th grade, the demographic groups most similar to Immigrants from Zimbabwe are Syrian (97.6%, a difference of 0.0%), Immigrants from France (97.6%, a difference of 0.0%), Immigrants from Japan (97.6%, a difference of 0.0%), Immigrants from Saudi Arabia (97.6%, a difference of 0.010%), and Basque (97.6%, a difference of 0.010%). Similarly, the demographic groups most similar to Bhutanese are Immigrants from Czechoslovakia (97.7%, a difference of 0.0%), Immigrants from Singapore (97.7%, a difference of 0.0%), German Russian (97.7%, a difference of 0.010%), Nonimmigrants (97.7%, a difference of 0.010%), and Choctaw (97.7%, a difference of 0.020%).
| Demographics | Rating | Rank | 5th Grade |
| Choctaw | 98.0 /100 | #102 | Exceptional 97.7% |
| Cheyenne | 97.9 /100 | #103 | Exceptional 97.7% |
| German Russians | 97.8 /100 | #104 | Exceptional 97.7% |
| Bhutanese | 97.6 /100 | #105 | Exceptional 97.7% |
| Immigrants | Czechoslovakia | 97.5 /100 | #106 | Exceptional 97.7% |
| Immigrants | Singapore | 97.5 /100 | #107 | Exceptional 97.7% |
| Immigrants | Nonimmigrants | 97.3 /100 | #108 | Exceptional 97.7% |
| Immigrants | Latvia | 97.1 /100 | #109 | Exceptional 97.7% |
| Thais | 96.9 /100 | #110 | Exceptional 97.7% |
| Menominee | 96.3 /100 | #111 | Exceptional 97.7% |
| Immigrants | Switzerland | 96.0 /100 | #112 | Exceptional 97.7% |
| Iroquois | 95.9 /100 | #113 | Exceptional 97.7% |
| Lebanese | 95.7 /100 | #114 | Exceptional 97.6% |
| Okinawans | 95.7 /100 | #115 | Exceptional 97.6% |
| Immigrants | Croatia | 95.5 /100 | #116 | Exceptional 97.6% |
| Immigrants | Saudi Arabia | 95.4 /100 | #117 | Exceptional 97.6% |
| Basques | 95.2 /100 | #118 | Exceptional 97.6% |
| Syrians | 95.1 /100 | #119 | Exceptional 97.6% |
| Immigrants | Zimbabwe | 94.9 /100 | #120 | Exceptional 97.6% |
| Immigrants | France | 94.8 /100 | #121 | Exceptional 97.6% |
| Immigrants | Japan | 94.7 /100 | #122 | Exceptional 97.6% |