Immigrants from Zaire vs Welsh Doctorate Degree
COMPARE
Immigrants from Zaire
Welsh
Doctorate Degree
Doctorate Degree Comparison
Immigrants from Zaire
Welsh
2.0%
DOCTORATE DEGREE
91.1/ 100
METRIC RATING
128th/ 347
METRIC RANK
1.9%
DOCTORATE DEGREE
69.7/ 100
METRIC RATING
160th/ 347
METRIC RANK
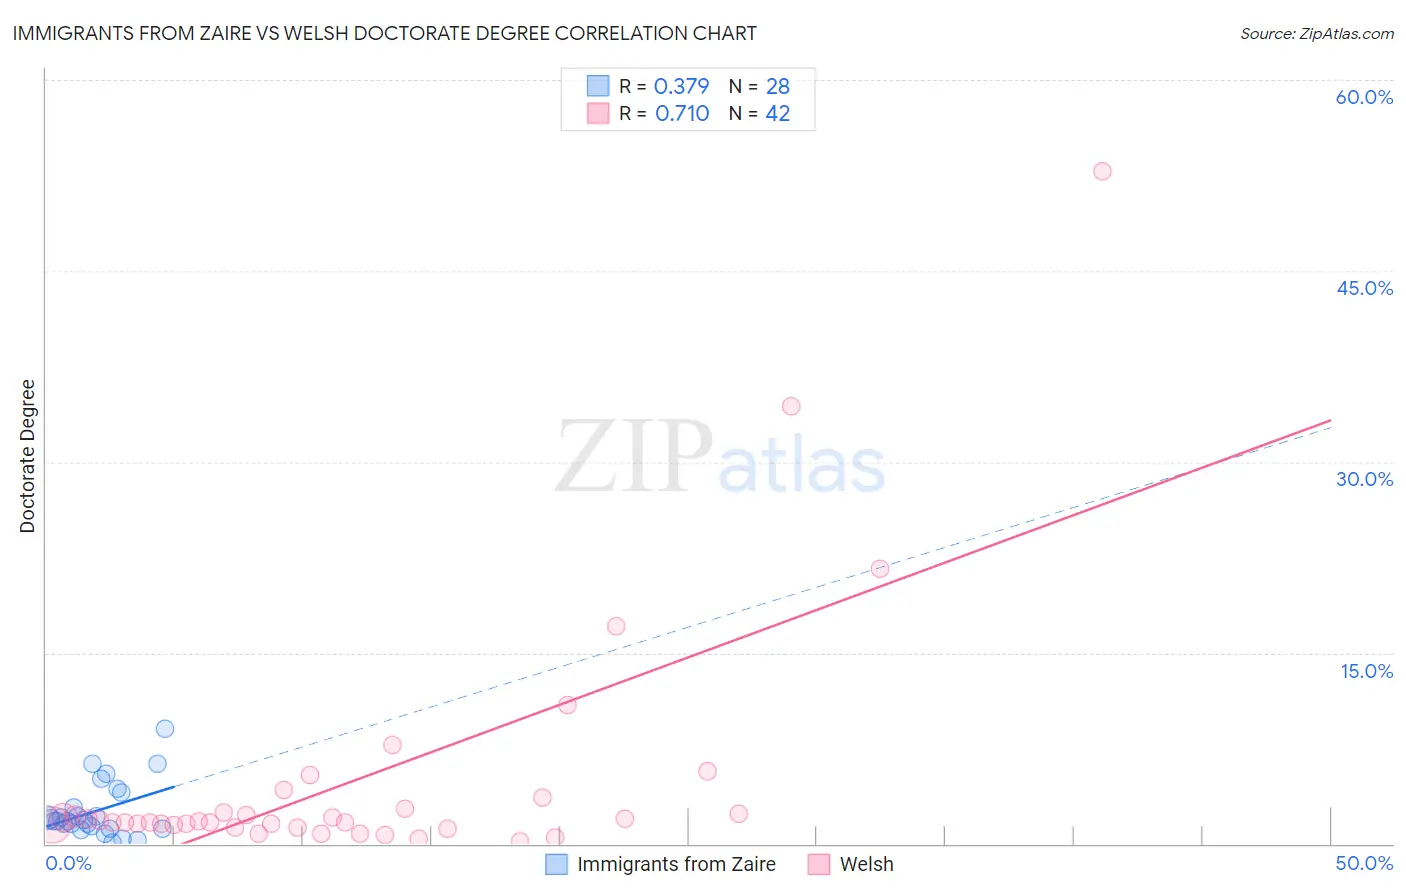
Immigrants from Zaire vs Welsh Doctorate Degree Correlation Chart
The statistical analysis conducted on geographies consisting of 107,152,130 people shows a mild positive correlation between the proportion of Immigrants from Zaire and percentage of population with at least doctorate degree education in the United States with a correlation coefficient (R) of 0.379 and weighted average of 2.0%. Similarly, the statistical analysis conducted on geographies consisting of 512,102,106 people shows a strong positive correlation between the proportion of Welsh and percentage of population with at least doctorate degree education in the United States with a correlation coefficient (R) of 0.710 and weighted average of 1.9%, a difference of 5.3%.
Doctorate Degree Correlation Summary
| Measurement | Immigrants from Zaire | Welsh |
| Minimum | 0.076% | 0.21% |
| Maximum | 9.0% | 52.8% |
| Range | 8.9% | 52.6% |
| Mean | 2.6% | 5.1% |
| Median | 1.8% | 1.7% |
| Interquartile 25% (IQ1) | 1.3% | 1.5% |
| Interquartile 75% (IQ3) | 3.4% | 2.7% |
| Interquartile Range (IQR) | 2.1% | 1.2% |
| Standard Deviation (Sample) | 2.1% | 9.9% |
| Standard Deviation (Population) | 2.1% | 9.8% |
Similar Demographics by Doctorate Degree
Demographics Similar to Immigrants from Zaire by Doctorate Degree
In terms of doctorate degree, the demographic groups most similar to Immigrants from Zaire are Canadian (2.0%, a difference of 0.22%), Immigrants from Ukraine (2.0%, a difference of 0.22%), Immigrants from Sierra Leone (2.0%, a difference of 0.36%), Palestinian (2.0%, a difference of 0.42%), and Jordanian (2.0%, a difference of 0.46%).
| Demographics | Rating | Rank | Doctorate Degree |
| Immigrants | Jordan | 94.8 /100 | #121 | Exceptional 2.0% |
| Immigrants | Southern Europe | 94.7 /100 | #122 | Exceptional 2.0% |
| Croatians | 94.0 /100 | #123 | Exceptional 2.0% |
| Ute | 93.2 /100 | #124 | Exceptional 2.0% |
| Moroccans | 93.0 /100 | #125 | Exceptional 2.0% |
| Jordanians | 92.1 /100 | #126 | Exceptional 2.0% |
| Palestinians | 92.0 /100 | #127 | Exceptional 2.0% |
| Immigrants | Zaire | 91.1 /100 | #128 | Exceptional 2.0% |
| Canadians | 90.6 /100 | #129 | Exceptional 2.0% |
| Immigrants | Ukraine | 90.5 /100 | #130 | Exceptional 2.0% |
| Immigrants | Sierra Leone | 90.2 /100 | #131 | Exceptional 2.0% |
| Scottish | 89.4 /100 | #132 | Excellent 2.0% |
| Immigrants | Uzbekistan | 89.3 /100 | #133 | Excellent 2.0% |
| Immigrants | Cameroon | 88.9 /100 | #134 | Excellent 2.0% |
| Serbians | 88.7 /100 | #135 | Excellent 2.0% |
Demographics Similar to Welsh by Doctorate Degree
In terms of doctorate degree, the demographic groups most similar to Welsh are Slovene (1.9%, a difference of 0.090%), Immigrants from Middle Africa (1.9%, a difference of 0.15%), Hungarian (1.9%, a difference of 0.35%), Irish (1.9%, a difference of 0.36%), and Danish (1.9%, a difference of 0.38%).
| Demographics | Rating | Rank | Doctorate Degree |
| Immigrants | Oceania | 74.0 /100 | #153 | Good 1.9% |
| Immigrants | Albania | 72.8 /100 | #154 | Good 1.9% |
| Poles | 72.7 /100 | #155 | Good 1.9% |
| Slavs | 72.4 /100 | #156 | Good 1.9% |
| Danes | 71.9 /100 | #157 | Good 1.9% |
| Hungarians | 71.7 /100 | #158 | Good 1.9% |
| Slovenes | 70.2 /100 | #159 | Good 1.9% |
| Welsh | 69.7 /100 | #160 | Good 1.9% |
| Immigrants | Middle Africa | 68.8 /100 | #161 | Good 1.9% |
| Irish | 67.5 /100 | #162 | Good 1.9% |
| Czechs | 67.3 /100 | #163 | Good 1.9% |
| Celtics | 66.7 /100 | #164 | Good 1.9% |
| Scotch-Irish | 63.6 /100 | #165 | Good 1.9% |
| Spaniards | 63.5 /100 | #166 | Good 1.9% |
| Macedonians | 60.9 /100 | #167 | Good 1.9% |