South American vs Welsh Doctorate Degree
COMPARE
South American
Welsh
Doctorate Degree
Doctorate Degree Comparison
South Americans
Welsh
1.8%
DOCTORATE DEGREE
29.5/ 100
METRIC RATING
191st/ 347
METRIC RANK
1.9%
DOCTORATE DEGREE
69.7/ 100
METRIC RATING
160th/ 347
METRIC RANK
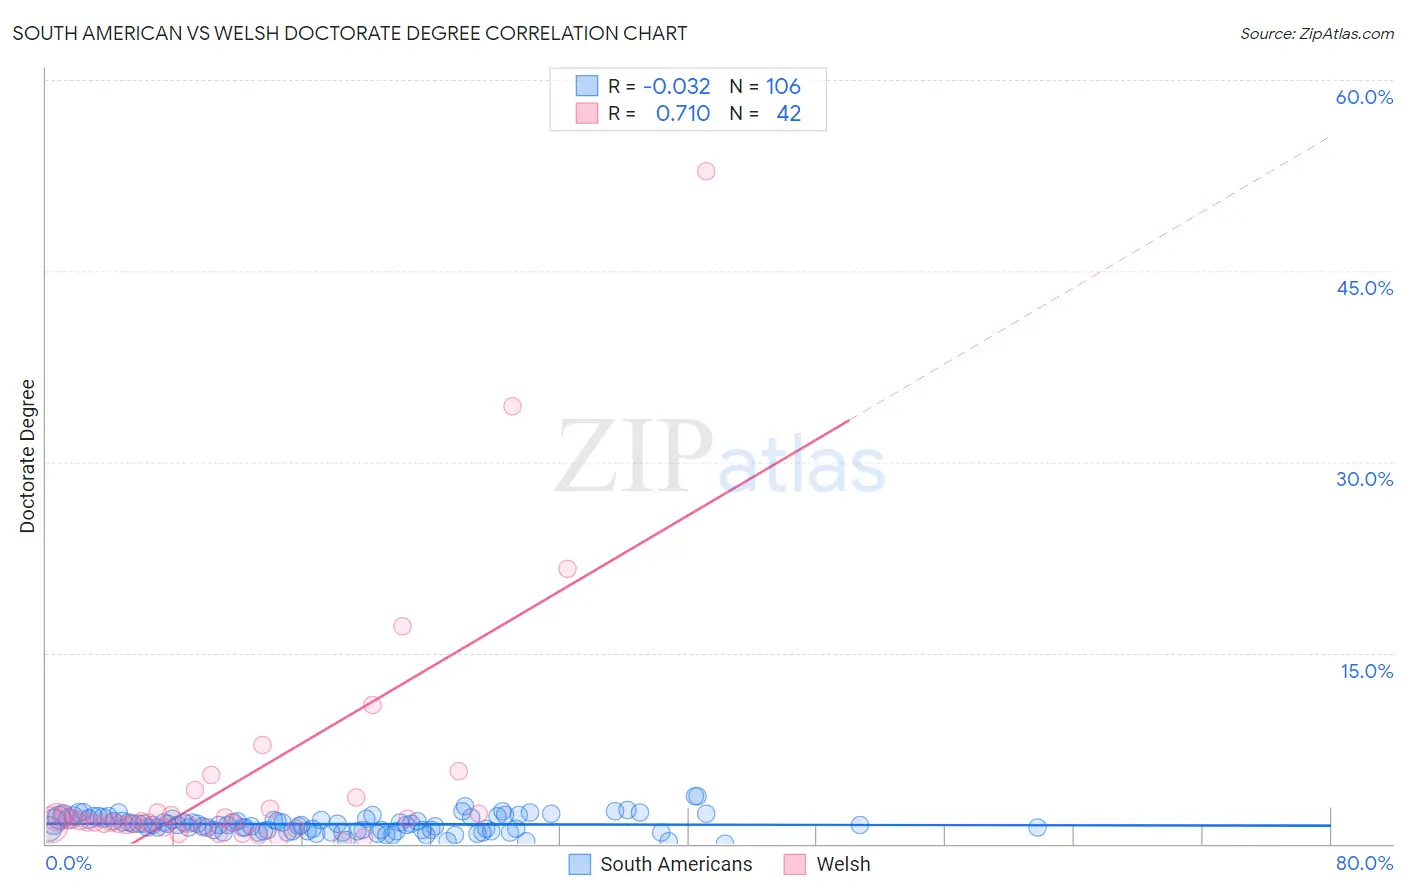
South American vs Welsh Doctorate Degree Correlation Chart
The statistical analysis conducted on geographies consisting of 486,603,366 people shows no correlation between the proportion of South Americans and percentage of population with at least doctorate degree education in the United States with a correlation coefficient (R) of -0.032 and weighted average of 1.8%. Similarly, the statistical analysis conducted on geographies consisting of 512,102,106 people shows a strong positive correlation between the proportion of Welsh and percentage of population with at least doctorate degree education in the United States with a correlation coefficient (R) of 0.710 and weighted average of 1.9%, a difference of 6.5%.
Doctorate Degree Correlation Summary
| Measurement | South American | Welsh |
| Minimum | 0.049% | 0.21% |
| Maximum | 3.7% | 52.8% |
| Range | 3.7% | 52.6% |
| Mean | 1.5% | 5.1% |
| Median | 1.5% | 1.7% |
| Interquartile 25% (IQ1) | 1.0% | 1.5% |
| Interquartile 75% (IQ3) | 2.0% | 2.7% |
| Interquartile Range (IQR) | 0.93% | 1.2% |
| Standard Deviation (Sample) | 0.68% | 9.9% |
| Standard Deviation (Population) | 0.68% | 9.8% |
Similar Demographics by Doctorate Degree
Demographics Similar to South Americans by Doctorate Degree
In terms of doctorate degree, the demographic groups most similar to South Americans are Immigrants from Costa Rica (1.8%, a difference of 0.12%), French Canadian (1.8%, a difference of 0.13%), German (1.8%, a difference of 0.18%), Dutch (1.8%, a difference of 0.39%), and German Russian (1.8%, a difference of 0.46%).
| Demographics | Rating | Rank | Doctorate Degree |
| Nigerians | 39.9 /100 | #184 | Fair 1.8% |
| Slovaks | 36.4 /100 | #185 | Fair 1.8% |
| Peruvians | 34.4 /100 | #186 | Fair 1.8% |
| Czechoslovakians | 33.0 /100 | #187 | Fair 1.8% |
| Germans | 30.5 /100 | #188 | Fair 1.8% |
| French Canadians | 30.2 /100 | #189 | Fair 1.8% |
| Immigrants | Costa Rica | 30.2 /100 | #190 | Fair 1.8% |
| South Americans | 29.5 /100 | #191 | Fair 1.8% |
| Dutch | 27.4 /100 | #192 | Fair 1.8% |
| German Russians | 27.1 /100 | #193 | Fair 1.8% |
| Uruguayans | 26.2 /100 | #194 | Fair 1.8% |
| Immigrants | Somalia | 25.4 /100 | #195 | Fair 1.8% |
| Sub-Saharan Africans | 25.1 /100 | #196 | Fair 1.8% |
| Chinese | 25.1 /100 | #197 | Fair 1.8% |
| Immigrants | Ghana | 24.6 /100 | #198 | Fair 1.8% |
Demographics Similar to Welsh by Doctorate Degree
In terms of doctorate degree, the demographic groups most similar to Welsh are Slovene (1.9%, a difference of 0.090%), Immigrants from Middle Africa (1.9%, a difference of 0.15%), Hungarian (1.9%, a difference of 0.35%), Irish (1.9%, a difference of 0.36%), and Danish (1.9%, a difference of 0.38%).
| Demographics | Rating | Rank | Doctorate Degree |
| Immigrants | Oceania | 74.0 /100 | #153 | Good 1.9% |
| Immigrants | Albania | 72.8 /100 | #154 | Good 1.9% |
| Poles | 72.7 /100 | #155 | Good 1.9% |
| Slavs | 72.4 /100 | #156 | Good 1.9% |
| Danes | 71.9 /100 | #157 | Good 1.9% |
| Hungarians | 71.7 /100 | #158 | Good 1.9% |
| Slovenes | 70.2 /100 | #159 | Good 1.9% |
| Welsh | 69.7 /100 | #160 | Good 1.9% |
| Immigrants | Middle Africa | 68.8 /100 | #161 | Good 1.9% |
| Irish | 67.5 /100 | #162 | Good 1.9% |
| Czechs | 67.3 /100 | #163 | Good 1.9% |
| Celtics | 66.7 /100 | #164 | Good 1.9% |
| Scotch-Irish | 63.6 /100 | #165 | Good 1.9% |
| Spaniards | 63.5 /100 | #166 | Good 1.9% |
| Macedonians | 60.9 /100 | #167 | Good 1.9% |