Immigrants from Zaire vs Tlingit-Haida Doctorate Degree
COMPARE
Immigrants from Zaire
Tlingit-Haida
Doctorate Degree
Doctorate Degree Comparison
Immigrants from Zaire
Tlingit-Haida
2.0%
DOCTORATE DEGREE
91.1/ 100
METRIC RATING
128th/ 347
METRIC RANK
1.7%
DOCTORATE DEGREE
11.9/ 100
METRIC RATING
218th/ 347
METRIC RANK
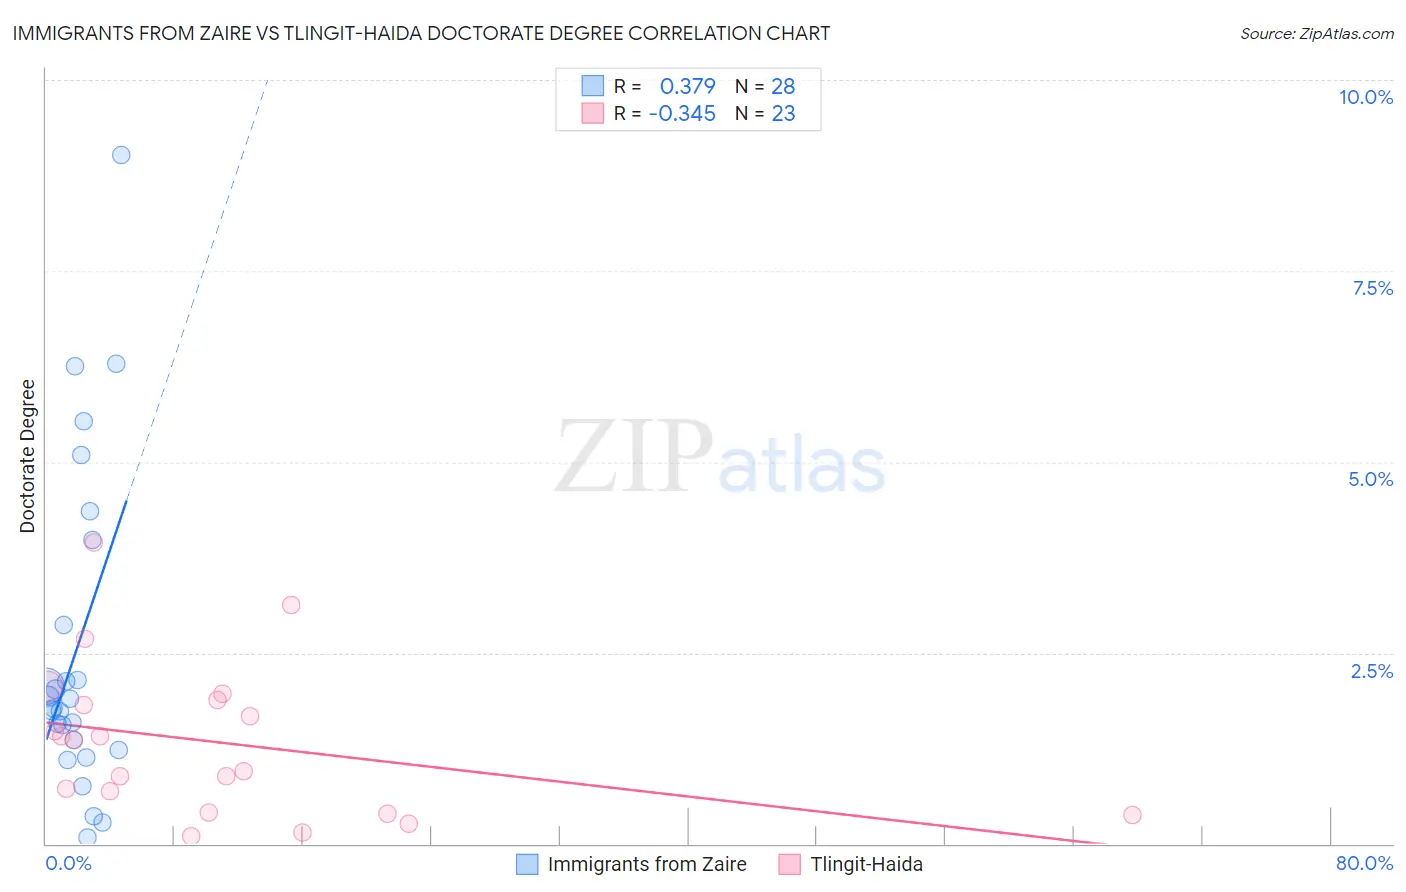
Immigrants from Zaire vs Tlingit-Haida Doctorate Degree Correlation Chart
The statistical analysis conducted on geographies consisting of 107,152,130 people shows a mild positive correlation between the proportion of Immigrants from Zaire and percentage of population with at least doctorate degree education in the United States with a correlation coefficient (R) of 0.379 and weighted average of 2.0%. Similarly, the statistical analysis conducted on geographies consisting of 60,593,373 people shows a mild negative correlation between the proportion of Tlingit-Haida and percentage of population with at least doctorate degree education in the United States with a correlation coefficient (R) of -0.345 and weighted average of 1.7%, a difference of 17.1%.
Doctorate Degree Correlation Summary
| Measurement | Immigrants from Zaire | Tlingit-Haida |
| Minimum | 0.076% | 0.099% |
| Maximum | 9.0% | 3.9% |
| Range | 8.9% | 3.8% |
| Mean | 2.6% | 1.3% |
| Median | 1.8% | 1.4% |
| Interquartile 25% (IQ1) | 1.3% | 0.41% |
| Interquartile 75% (IQ3) | 3.4% | 1.9% |
| Interquartile Range (IQR) | 2.1% | 1.5% |
| Standard Deviation (Sample) | 2.1% | 0.99% |
| Standard Deviation (Population) | 2.1% | 0.97% |
Similar Demographics by Doctorate Degree
Demographics Similar to Immigrants from Zaire by Doctorate Degree
In terms of doctorate degree, the demographic groups most similar to Immigrants from Zaire are Canadian (2.0%, a difference of 0.22%), Immigrants from Ukraine (2.0%, a difference of 0.22%), Immigrants from Sierra Leone (2.0%, a difference of 0.36%), Palestinian (2.0%, a difference of 0.42%), and Jordanian (2.0%, a difference of 0.46%).
| Demographics | Rating | Rank | Doctorate Degree |
| Immigrants | Jordan | 94.8 /100 | #121 | Exceptional 2.0% |
| Immigrants | Southern Europe | 94.7 /100 | #122 | Exceptional 2.0% |
| Croatians | 94.0 /100 | #123 | Exceptional 2.0% |
| Ute | 93.2 /100 | #124 | Exceptional 2.0% |
| Moroccans | 93.0 /100 | #125 | Exceptional 2.0% |
| Jordanians | 92.1 /100 | #126 | Exceptional 2.0% |
| Palestinians | 92.0 /100 | #127 | Exceptional 2.0% |
| Immigrants | Zaire | 91.1 /100 | #128 | Exceptional 2.0% |
| Canadians | 90.6 /100 | #129 | Exceptional 2.0% |
| Immigrants | Ukraine | 90.5 /100 | #130 | Exceptional 2.0% |
| Immigrants | Sierra Leone | 90.2 /100 | #131 | Exceptional 2.0% |
| Scottish | 89.4 /100 | #132 | Excellent 2.0% |
| Immigrants | Uzbekistan | 89.3 /100 | #133 | Excellent 2.0% |
| Immigrants | Cameroon | 88.9 /100 | #134 | Excellent 2.0% |
| Serbians | 88.7 /100 | #135 | Excellent 2.0% |
Demographics Similar to Tlingit-Haida by Doctorate Degree
In terms of doctorate degree, the demographic groups most similar to Tlingit-Haida are Spanish American (1.7%, a difference of 0.37%), Immigrants from Iraq (1.7%, a difference of 0.46%), Immigrants from Burma/Myanmar (1.7%, a difference of 0.58%), Alaskan Athabascan (1.7%, a difference of 0.68%), and Pueblo (1.7%, a difference of 0.82%).
| Demographics | Rating | Rank | Doctorate Degree |
| Immigrants | Armenia | 15.1 /100 | #211 | Poor 1.7% |
| Immigrants | South Eastern Asia | 14.7 /100 | #212 | Poor 1.7% |
| Koreans | 14.2 /100 | #213 | Poor 1.7% |
| Pueblo | 14.2 /100 | #214 | Poor 1.7% |
| Alaskan Athabascans | 13.8 /100 | #215 | Poor 1.7% |
| Immigrants | Burma/Myanmar | 13.5 /100 | #216 | Poor 1.7% |
| Spanish Americans | 12.9 /100 | #217 | Poor 1.7% |
| Tlingit-Haida | 11.9 /100 | #218 | Poor 1.7% |
| Immigrants | Iraq | 10.7 /100 | #219 | Poor 1.7% |
| Immigrants | Uruguay | 9.2 /100 | #220 | Tragic 1.7% |
| Immigrants | Nonimmigrants | 8.8 /100 | #221 | Tragic 1.7% |
| Immigrants | Venezuela | 8.7 /100 | #222 | Tragic 1.7% |
| Immigrants | Bosnia and Herzegovina | 7.8 /100 | #223 | Tragic 1.7% |
| Immigrants | Poland | 7.4 /100 | #224 | Tragic 1.7% |
| Immigrants | Colombia | 6.7 /100 | #225 | Tragic 1.7% |