Immigrants from Zaire vs Haitian 9th Grade
COMPARE
Immigrants from Zaire
Haitian
9th Grade
9th Grade Comparison
Immigrants from Zaire
Haitians
94.6%
9TH GRADE
20.6/ 100
METRIC RATING
200th/ 347
METRIC RANK
93.1%
9TH GRADE
0.0/ 100
METRIC RATING
298th/ 347
METRIC RANK
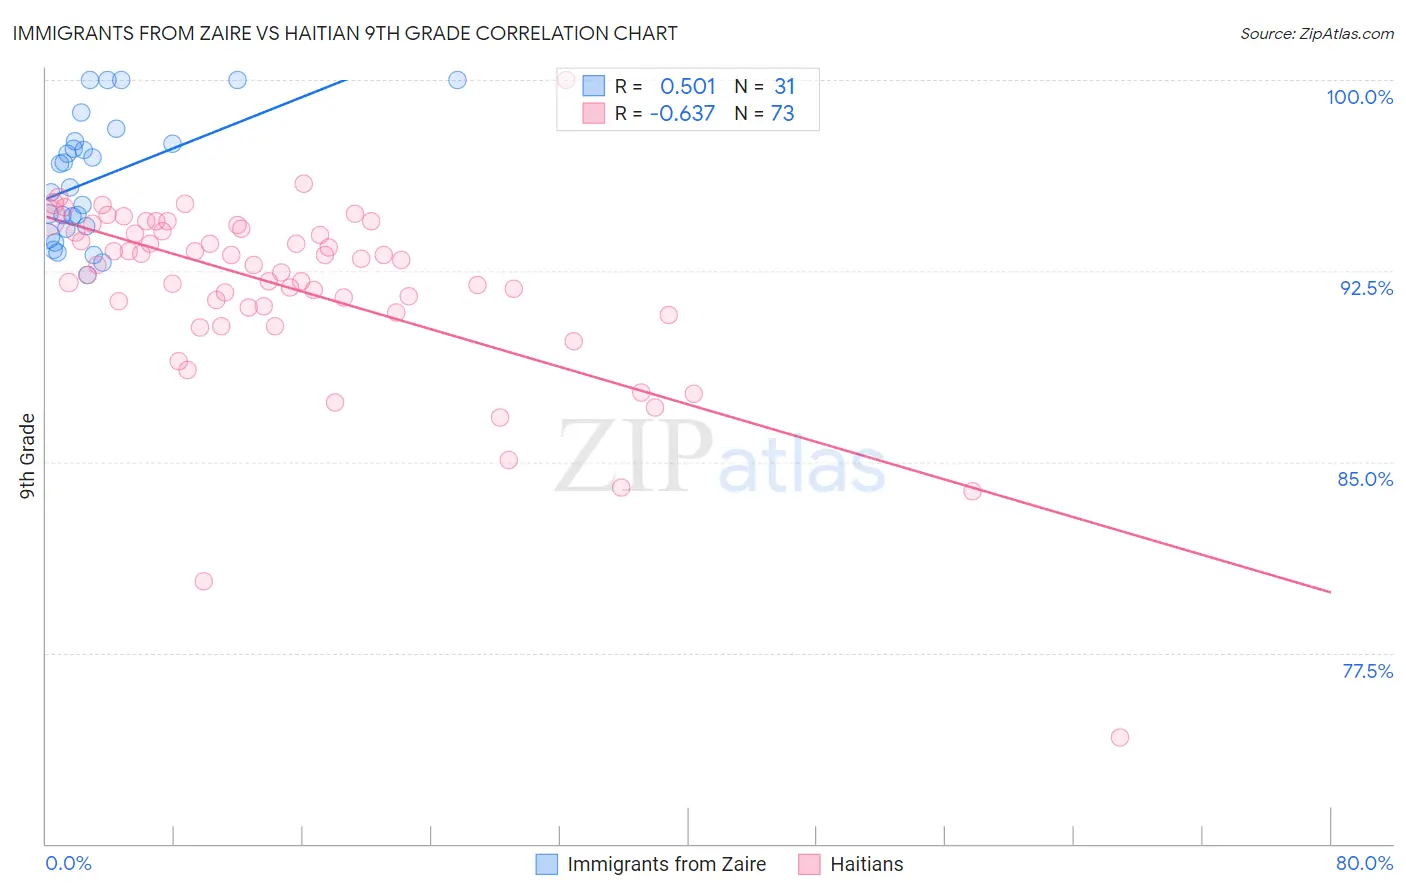
Immigrants from Zaire vs Haitian 9th Grade Correlation Chart
The statistical analysis conducted on geographies consisting of 107,212,695 people shows a substantial positive correlation between the proportion of Immigrants from Zaire and percentage of population with at least 9th grade education in the United States with a correlation coefficient (R) of 0.501 and weighted average of 94.6%. Similarly, the statistical analysis conducted on geographies consisting of 288,012,546 people shows a significant negative correlation between the proportion of Haitians and percentage of population with at least 9th grade education in the United States with a correlation coefficient (R) of -0.637 and weighted average of 93.1%, a difference of 1.7%.
9th Grade Correlation Summary
| Measurement | Immigrants from Zaire | Haitian |
| Minimum | 92.3% | 74.2% |
| Maximum | 100.0% | 100.0% |
| Range | 7.7% | 25.8% |
| Mean | 96.1% | 91.8% |
| Median | 95.8% | 92.7% |
| Interquartile 25% (IQ1) | 94.2% | 91.0% |
| Interquartile 75% (IQ3) | 97.6% | 94.1% |
| Interquartile Range (IQR) | 3.4% | 3.1% |
| Standard Deviation (Sample) | 2.4% | 3.8% |
| Standard Deviation (Population) | 2.4% | 3.7% |
Similar Demographics by 9th Grade
Demographics Similar to Immigrants from Zaire by 9th Grade
In terms of 9th grade, the demographic groups most similar to Immigrants from Zaire are Laotian (94.6%, a difference of 0.0%), Black/African American (94.6%, a difference of 0.0%), Immigrants from Eastern Asia (94.6%, a difference of 0.010%), Immigrants from Bahamas (94.6%, a difference of 0.010%), and Moroccan (94.6%, a difference of 0.010%).
| Demographics | Rating | Rank | 9th Grade |
| Paraguayans | 30.1 /100 | #193 | Fair 94.7% |
| Panamanians | 29.0 /100 | #194 | Fair 94.7% |
| Marshallese | 27.9 /100 | #195 | Fair 94.7% |
| Immigrants | Lebanon | 27.2 /100 | #196 | Fair 94.7% |
| Immigrants | Micronesia | 24.7 /100 | #197 | Fair 94.7% |
| Hawaiians | 22.7 /100 | #198 | Fair 94.7% |
| Laotians | 21.0 /100 | #199 | Fair 94.6% |
| Immigrants | Zaire | 20.6 /100 | #200 | Fair 94.6% |
| Blacks/African Americans | 20.5 /100 | #201 | Fair 94.6% |
| Immigrants | Eastern Asia | 19.8 /100 | #202 | Poor 94.6% |
| Immigrants | Bahamas | 19.8 /100 | #203 | Poor 94.6% |
| Moroccans | 19.6 /100 | #204 | Poor 94.6% |
| Immigrants | Sudan | 17.6 /100 | #205 | Poor 94.6% |
| Samoans | 17.3 /100 | #206 | Poor 94.6% |
| Immigrants | Morocco | 16.3 /100 | #207 | Poor 94.6% |
Demographics Similar to Haitians by 9th Grade
In terms of 9th grade, the demographic groups most similar to Haitians are Fijian (93.1%, a difference of 0.030%), Immigrants from Burma/Myanmar (93.1%, a difference of 0.060%), Indonesian (93.1%, a difference of 0.060%), Immigrants from Grenada (93.0%, a difference of 0.060%), and Sri Lankan (93.2%, a difference of 0.080%).
| Demographics | Rating | Rank | 9th Grade |
| British West Indians | 0.0 /100 | #291 | Tragic 93.2% |
| Immigrants | Laos | 0.0 /100 | #292 | Tragic 93.2% |
| Sri Lankans | 0.0 /100 | #293 | Tragic 93.2% |
| Cubans | 0.0 /100 | #294 | Tragic 93.2% |
| Immigrants | Burma/Myanmar | 0.0 /100 | #295 | Tragic 93.1% |
| Indonesians | 0.0 /100 | #296 | Tragic 93.1% |
| Fijians | 0.0 /100 | #297 | Tragic 93.1% |
| Haitians | 0.0 /100 | #298 | Tragic 93.1% |
| Immigrants | Grenada | 0.0 /100 | #299 | Tragic 93.0% |
| Yaqui | 0.0 /100 | #300 | Tragic 92.9% |
| Immigrants | Haiti | 0.0 /100 | #301 | Tragic 92.7% |
| Immigrants | Dominica | 0.0 /100 | #302 | Tragic 92.7% |
| Guyanese | 0.0 /100 | #303 | Tragic 92.7% |
| Tohono O'odham | 0.0 /100 | #304 | Tragic 92.6% |
| Japanese | 0.0 /100 | #305 | Tragic 92.6% |