Immigrants from Zaire vs Haitian 12th Grade, No Diploma
COMPARE
Immigrants from Zaire
Haitian
12th Grade, No Diploma
12th Grade, No Diploma Comparison
Immigrants from Zaire
Haitians
90.3%
12TH GRADE, NO DIPLOMA
4.6/ 100
METRIC RATING
226th/ 347
METRIC RANK
88.5%
12TH GRADE, NO DIPLOMA
0.0/ 100
METRIC RATING
291st/ 347
METRIC RANK
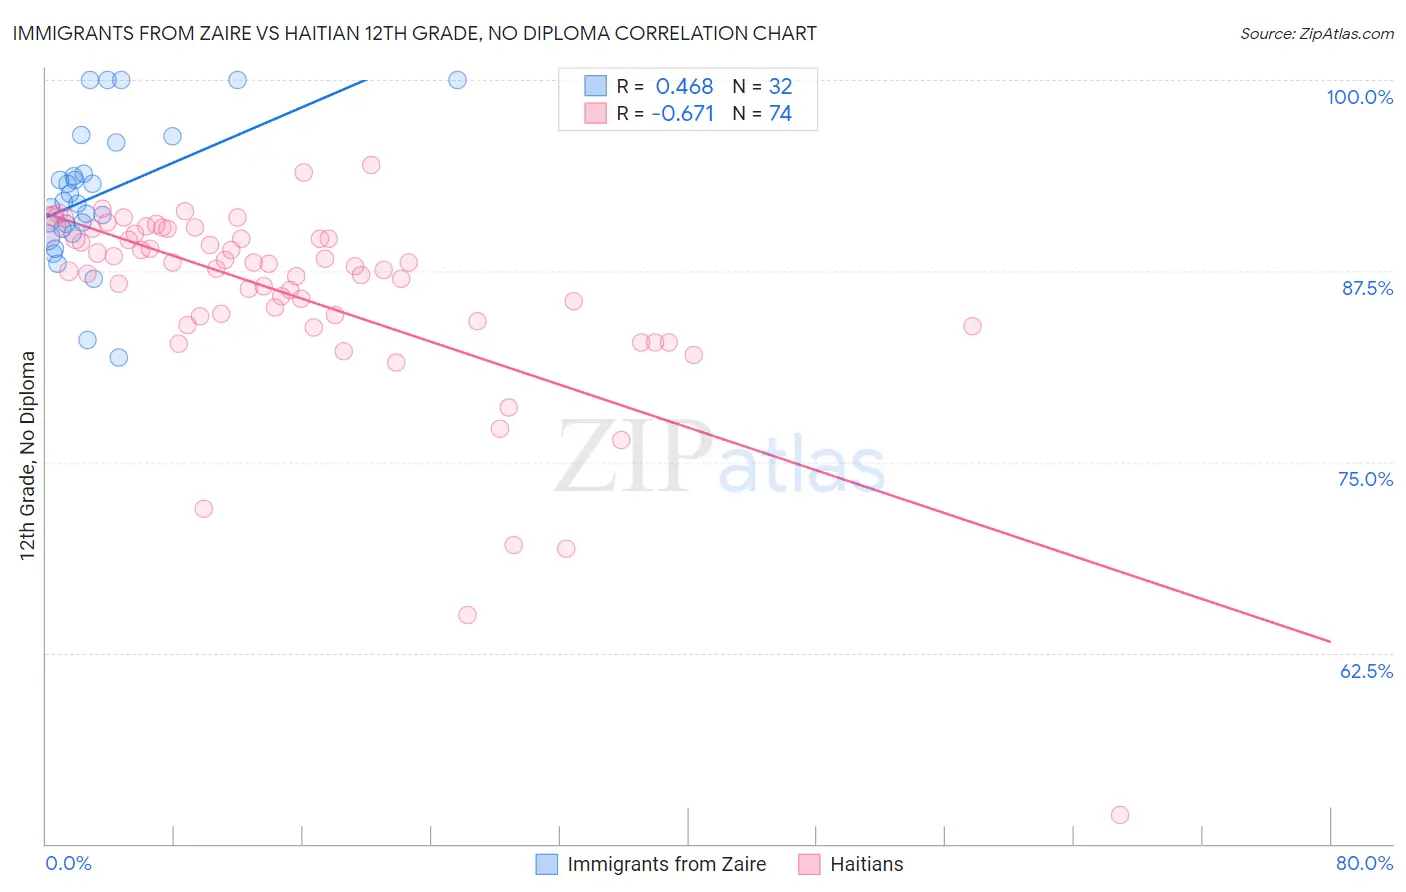
Immigrants from Zaire vs Haitian 12th Grade, No Diploma Correlation Chart
The statistical analysis conducted on geographies consisting of 107,255,805 people shows a moderate positive correlation between the proportion of Immigrants from Zaire and percentage of population with at least 12th grade (no diploma) education in the United States with a correlation coefficient (R) of 0.468 and weighted average of 90.3%. Similarly, the statistical analysis conducted on geographies consisting of 288,018,742 people shows a significant negative correlation between the proportion of Haitians and percentage of population with at least 12th grade (no diploma) education in the United States with a correlation coefficient (R) of -0.671 and weighted average of 88.5%, a difference of 2.0%.
12th Grade, No Diploma Correlation Summary
| Measurement | Immigrants from Zaire | Haitian |
| Minimum | 81.9% | 51.9% |
| Maximum | 100.0% | 94.5% |
| Range | 18.1% | 42.5% |
| Mean | 92.5% | 85.8% |
| Median | 91.9% | 87.7% |
| Interquartile 25% (IQ1) | 90.1% | 84.2% |
| Interquartile 75% (IQ3) | 94.9% | 89.6% |
| Interquartile Range (IQR) | 4.8% | 5.4% |
| Standard Deviation (Sample) | 4.6% | 6.8% |
| Standard Deviation (Population) | 4.5% | 6.7% |
Similar Demographics by 12th Grade, No Diploma
Demographics Similar to Immigrants from Zaire by 12th Grade, No Diploma
In terms of 12th grade, no diploma, the demographic groups most similar to Immigrants from Zaire are Immigrants from Panama (90.3%, a difference of 0.010%), Chickasaw (90.3%, a difference of 0.010%), Nigerian (90.3%, a difference of 0.010%), South American (90.3%, a difference of 0.030%), and Immigrants from Somalia (90.4%, a difference of 0.040%).
| Demographics | Rating | Rank | 12th Grade, No Diploma |
| Uruguayans | 7.0 /100 | #219 | Tragic 90.4% |
| Colombians | 6.6 /100 | #220 | Tragic 90.4% |
| Immigrants | Liberia | 5.7 /100 | #221 | Tragic 90.4% |
| Immigrants | Somalia | 5.3 /100 | #222 | Tragic 90.4% |
| South Americans | 5.0 /100 | #223 | Tragic 90.3% |
| Immigrants | Panama | 4.8 /100 | #224 | Tragic 90.3% |
| Chickasaw | 4.8 /100 | #225 | Tragic 90.3% |
| Immigrants | Zaire | 4.6 /100 | #226 | Tragic 90.3% |
| Nigerians | 4.5 /100 | #227 | Tragic 90.3% |
| Creek | 3.9 /100 | #228 | Tragic 90.3% |
| Immigrants | Bahamas | 3.6 /100 | #229 | Tragic 90.2% |
| Immigrants | Philippines | 2.8 /100 | #230 | Tragic 90.2% |
| Peruvians | 2.7 /100 | #231 | Tragic 90.2% |
| Blackfeet | 2.4 /100 | #232 | Tragic 90.1% |
| Immigrants | Thailand | 2.3 /100 | #233 | Tragic 90.1% |
Demographics Similar to Haitians by 12th Grade, No Diploma
In terms of 12th grade, no diploma, the demographic groups most similar to Haitians are Dutch West Indian (88.5%, a difference of 0.0%), British West Indian (88.5%, a difference of 0.0%), Immigrants from Fiji (88.6%, a difference of 0.10%), Hopi (88.6%, a difference of 0.11%), and Indonesian (88.6%, a difference of 0.12%).
| Demographics | Rating | Rank | 12th Grade, No Diploma |
| Pennsylvania Germans | 0.0 /100 | #284 | Tragic 88.7% |
| Indonesians | 0.0 /100 | #285 | Tragic 88.6% |
| Immigrants | West Indies | 0.0 /100 | #286 | Tragic 88.6% |
| Hopi | 0.0 /100 | #287 | Tragic 88.6% |
| Immigrants | Fiji | 0.0 /100 | #288 | Tragic 88.6% |
| Dutch West Indians | 0.0 /100 | #289 | Tragic 88.5% |
| British West Indians | 0.0 /100 | #290 | Tragic 88.5% |
| Haitians | 0.0 /100 | #291 | Tragic 88.5% |
| Immigrants | Grenada | 0.0 /100 | #292 | Tragic 88.4% |
| Japanese | 0.0 /100 | #293 | Tragic 88.3% |
| Guyanese | 0.0 /100 | #294 | Tragic 88.3% |
| Immigrants | Immigrants | 0.0 /100 | #295 | Tragic 88.2% |
| Fijians | 0.0 /100 | #296 | Tragic 88.2% |
| Pueblo | 0.0 /100 | #297 | Tragic 88.2% |
| Immigrants | Haiti | 0.0 /100 | #298 | Tragic 88.2% |