Immigrants from Yemen vs Belgian Doctorate Degree
COMPARE
Immigrants from Yemen
Belgian
Doctorate Degree
Doctorate Degree Comparison
Immigrants from Yemen
Belgians
1.4%
DOCTORATE DEGREE
0.2/ 100
METRIC RATING
293rd/ 347
METRIC RANK
1.8%
DOCTORATE DEGREE
50.3/ 100
METRIC RATING
172nd/ 347
METRIC RANK
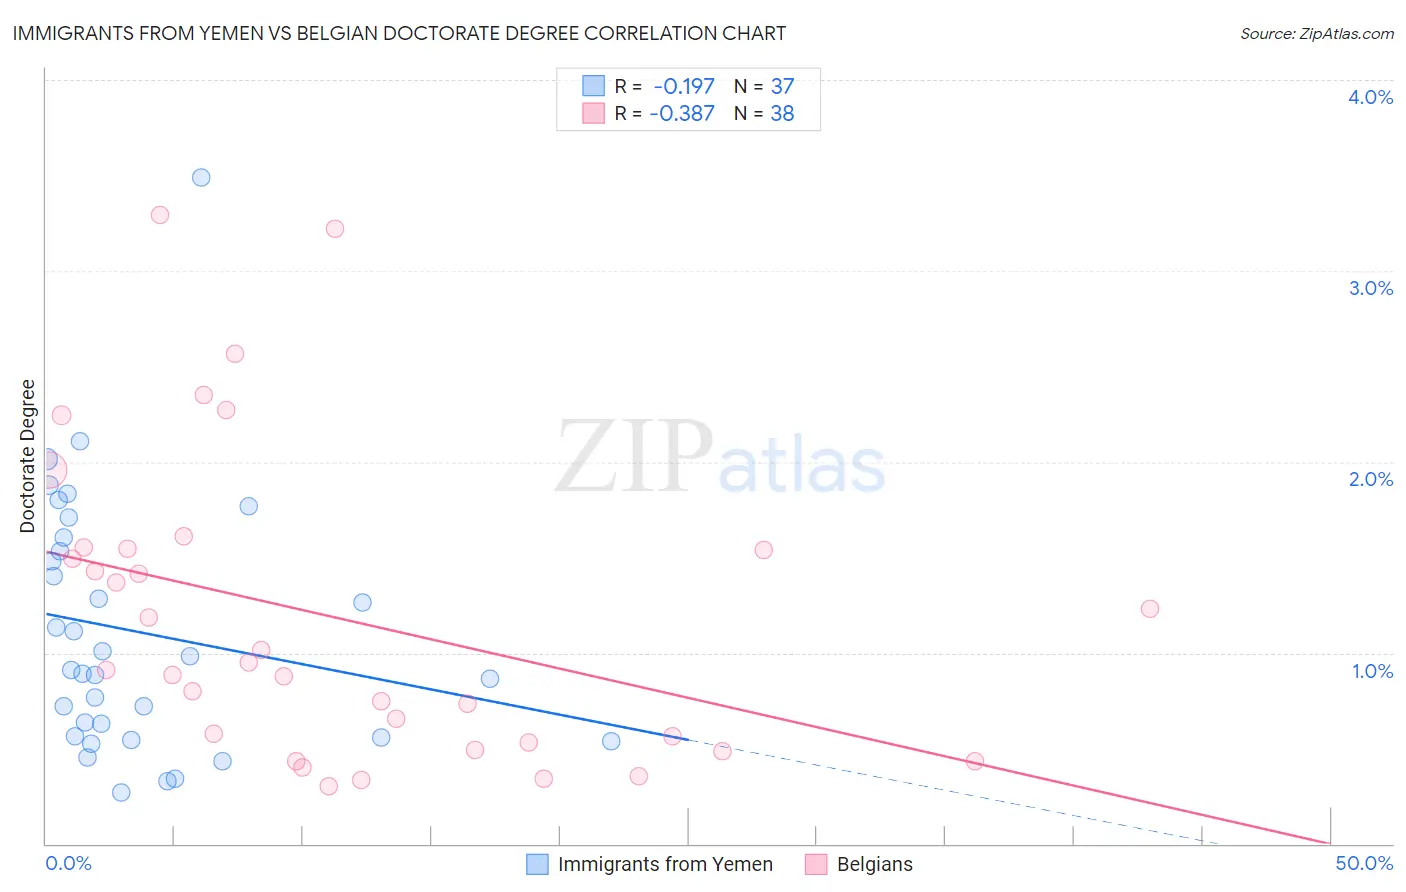
Immigrants from Yemen vs Belgian Doctorate Degree Correlation Chart
The statistical analysis conducted on geographies consisting of 82,189,372 people shows a poor negative correlation between the proportion of Immigrants from Yemen and percentage of population with at least doctorate degree education in the United States with a correlation coefficient (R) of -0.197 and weighted average of 1.4%. Similarly, the statistical analysis conducted on geographies consisting of 351,946,706 people shows a mild negative correlation between the proportion of Belgians and percentage of population with at least doctorate degree education in the United States with a correlation coefficient (R) of -0.387 and weighted average of 1.8%, a difference of 28.5%.
Doctorate Degree Correlation Summary
| Measurement | Immigrants from Yemen | Belgian |
| Minimum | 0.27% | 0.30% |
| Maximum | 3.5% | 3.3% |
| Range | 3.2% | 3.0% |
| Mean | 1.1% | 1.2% |
| Median | 0.91% | 0.93% |
| Interquartile 25% (IQ1) | 0.56% | 0.53% |
| Interquartile 75% (IQ3) | 1.6% | 1.5% |
| Interquartile Range (IQR) | 1.0% | 1.0% |
| Standard Deviation (Sample) | 0.67% | 0.80% |
| Standard Deviation (Population) | 0.66% | 0.79% |
Similar Demographics by Doctorate Degree
Demographics Similar to Immigrants from Yemen by Doctorate Degree
In terms of doctorate degree, the demographic groups most similar to Immigrants from Yemen are Alaska Native (1.4%, a difference of 0.59%), Samoan (1.4%, a difference of 0.71%), Black/African American (1.4%, a difference of 0.76%), Choctaw (1.4%, a difference of 0.99%), and Cape Verdean (1.4%, a difference of 1.0%).
| Demographics | Rating | Rank | Doctorate Degree |
| Cherokee | 0.3 /100 | #286 | Tragic 1.5% |
| Cajuns | 0.3 /100 | #287 | Tragic 1.5% |
| Immigrants | El Salvador | 0.3 /100 | #288 | Tragic 1.4% |
| Cape Verdeans | 0.3 /100 | #289 | Tragic 1.4% |
| Choctaw | 0.3 /100 | #290 | Tragic 1.4% |
| Blacks/African Americans | 0.3 /100 | #291 | Tragic 1.4% |
| Alaska Natives | 0.3 /100 | #292 | Tragic 1.4% |
| Immigrants | Yemen | 0.2 /100 | #293 | Tragic 1.4% |
| Samoans | 0.2 /100 | #294 | Tragic 1.4% |
| Guatemalans | 0.2 /100 | #295 | Tragic 1.4% |
| Immigrants | Ecuador | 0.2 /100 | #296 | Tragic 1.4% |
| Tsimshian | 0.2 /100 | #297 | Tragic 1.4% |
| Puerto Ricans | 0.1 /100 | #298 | Tragic 1.4% |
| Belizeans | 0.1 /100 | #299 | Tragic 1.4% |
| Immigrants | Guatemala | 0.1 /100 | #300 | Tragic 1.4% |
Demographics Similar to Belgians by Doctorate Degree
In terms of doctorate degree, the demographic groups most similar to Belgians are Norwegian (1.8%, a difference of 0.040%), Immigrants from Bangladesh (1.8%, a difference of 0.040%), Immigrants from Thailand (1.8%, a difference of 0.12%), Spanish (1.8%, a difference of 0.14%), and Iraqi (1.8%, a difference of 0.15%).
| Demographics | Rating | Rank | Doctorate Degree |
| Scotch-Irish | 63.6 /100 | #165 | Good 1.9% |
| Spaniards | 63.5 /100 | #166 | Good 1.9% |
| Macedonians | 60.9 /100 | #167 | Good 1.9% |
| Sri Lankans | 60.3 /100 | #168 | Good 1.9% |
| Vietnamese | 54.8 /100 | #169 | Average 1.9% |
| Costa Ricans | 53.3 /100 | #170 | Average 1.8% |
| Bermudans | 52.1 /100 | #171 | Average 1.8% |
| Belgians | 50.3 /100 | #172 | Average 1.8% |
| Norwegians | 50.0 /100 | #173 | Average 1.8% |
| Immigrants | Bangladesh | 50.0 /100 | #174 | Average 1.8% |
| Immigrants | Thailand | 49.4 /100 | #175 | Average 1.8% |
| Spanish | 49.3 /100 | #176 | Average 1.8% |
| Iraqis | 49.2 /100 | #177 | Average 1.8% |
| French | 48.8 /100 | #178 | Average 1.8% |
| Ghanaians | 48.3 /100 | #179 | Average 1.8% |