Immigrants from Western Asia vs Thai Doctorate Degree
COMPARE
Immigrants from Western Asia
Thai
Doctorate Degree
Doctorate Degree Comparison
Immigrants from Western Asia
Thais
2.2%
DOCTORATE DEGREE
99.8/ 100
METRIC RATING
75th/ 347
METRIC RANK
2.8%
DOCTORATE DEGREE
100.0/ 100
METRIC RATING
21st/ 347
METRIC RANK
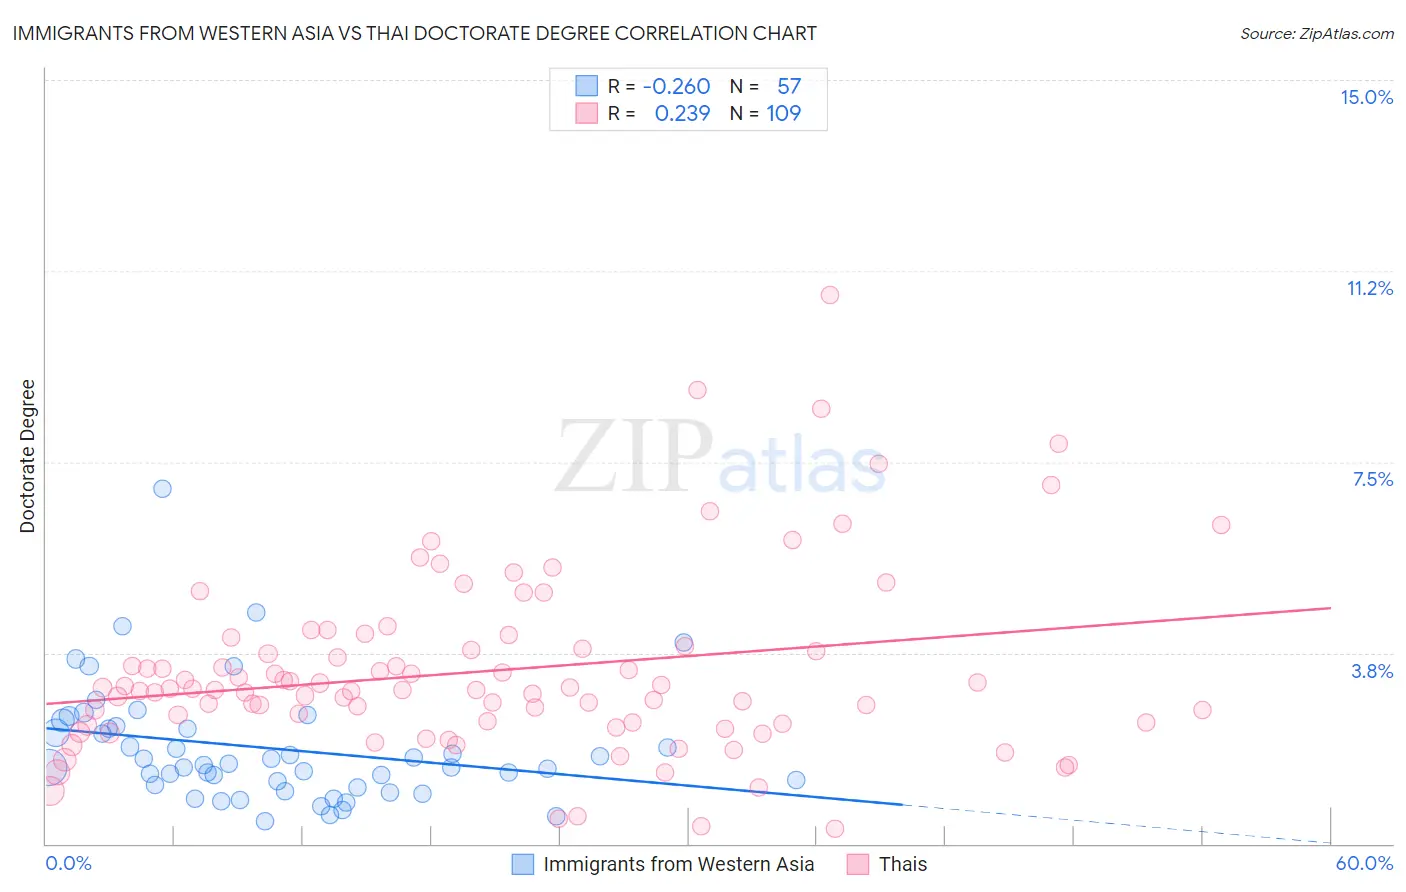
Immigrants from Western Asia vs Thai Doctorate Degree Correlation Chart
The statistical analysis conducted on geographies consisting of 401,633,885 people shows a weak negative correlation between the proportion of Immigrants from Western Asia and percentage of population with at least doctorate degree education in the United States with a correlation coefficient (R) of -0.260 and weighted average of 2.2%. Similarly, the statistical analysis conducted on geographies consisting of 470,013,150 people shows a weak positive correlation between the proportion of Thais and percentage of population with at least doctorate degree education in the United States with a correlation coefficient (R) of 0.239 and weighted average of 2.8%, a difference of 23.0%.
Doctorate Degree Correlation Summary
| Measurement | Immigrants from Western Asia | Thai |
| Minimum | 0.43% | 0.30% |
| Maximum | 7.0% | 10.8% |
| Range | 6.5% | 10.5% |
| Mean | 1.9% | 3.4% |
| Median | 1.6% | 3.0% |
| Interquartile 25% (IQ1) | 1.1% | 2.4% |
| Interquartile 75% (IQ3) | 2.3% | 3.8% |
| Interquartile Range (IQR) | 1.2% | 1.5% |
| Standard Deviation (Sample) | 1.2% | 1.8% |
| Standard Deviation (Population) | 1.2% | 1.8% |
Similar Demographics by Doctorate Degree
Demographics Similar to Immigrants from Western Asia by Doctorate Degree
In terms of doctorate degree, the demographic groups most similar to Immigrants from Western Asia are Immigrants from Hungary (2.2%, a difference of 0.070%), Immigrants from Lebanon (2.2%, a difference of 0.080%), Immigrants from North America (2.2%, a difference of 0.10%), Immigrants from Bulgaria (2.3%, a difference of 0.24%), and Immigrants from Canada (2.3%, a difference of 0.32%).
| Demographics | Rating | Rank | Doctorate Degree |
| Immigrants | Kazakhstan | 99.8 /100 | #68 | Exceptional 2.3% |
| Carpatho Rusyns | 99.8 /100 | #69 | Exceptional 2.3% |
| Lithuanians | 99.8 /100 | #70 | Exceptional 2.3% |
| Immigrants | Bolivia | 99.8 /100 | #71 | Exceptional 2.3% |
| Immigrants | Canada | 99.8 /100 | #72 | Exceptional 2.3% |
| Immigrants | Bulgaria | 99.8 /100 | #73 | Exceptional 2.3% |
| Immigrants | North America | 99.8 /100 | #74 | Exceptional 2.2% |
| Immigrants | Western Asia | 99.8 /100 | #75 | Exceptional 2.2% |
| Immigrants | Hungary | 99.8 /100 | #76 | Exceptional 2.2% |
| Immigrants | Lebanon | 99.8 /100 | #77 | Exceptional 2.2% |
| Immigrants | Belarus | 99.7 /100 | #78 | Exceptional 2.2% |
| Northern Europeans | 99.7 /100 | #79 | Exceptional 2.2% |
| Ugandans | 99.7 /100 | #80 | Exceptional 2.2% |
| Immigrants | Argentina | 99.7 /100 | #81 | Exceptional 2.2% |
| Immigrants | Uganda | 99.6 /100 | #82 | Exceptional 2.2% |
Demographics Similar to Thais by Doctorate Degree
In terms of doctorate degree, the demographic groups most similar to Thais are Mongolian (2.8%, a difference of 0.20%), Immigrants from Denmark (2.8%, a difference of 0.33%), Immigrants from Hong Kong (2.8%, a difference of 0.35%), Immigrants from Japan (2.8%, a difference of 0.70%), and Immigrants from Sri Lanka (2.8%, a difference of 1.1%).
| Demographics | Rating | Rank | Doctorate Degree |
| Immigrants | France | 100.0 /100 | #14 | Exceptional 2.9% |
| Immigrants | India | 100.0 /100 | #15 | Exceptional 2.8% |
| Eastern Europeans | 100.0 /100 | #16 | Exceptional 2.8% |
| Immigrants | Australia | 100.0 /100 | #17 | Exceptional 2.8% |
| Immigrants | Sri Lanka | 100.0 /100 | #18 | Exceptional 2.8% |
| Immigrants | Japan | 100.0 /100 | #19 | Exceptional 2.8% |
| Immigrants | Hong Kong | 100.0 /100 | #20 | Exceptional 2.8% |
| Thais | 100.0 /100 | #21 | Exceptional 2.8% |
| Mongolians | 100.0 /100 | #22 | Exceptional 2.8% |
| Immigrants | Denmark | 100.0 /100 | #23 | Exceptional 2.8% |
| Israelis | 100.0 /100 | #24 | Exceptional 2.7% |
| Immigrants | Saudi Arabia | 100.0 /100 | #25 | Exceptional 2.7% |
| Turks | 100.0 /100 | #26 | Exceptional 2.7% |
| Immigrants | Turkey | 100.0 /100 | #27 | Exceptional 2.6% |
| Burmese | 100.0 /100 | #28 | Exceptional 2.6% |