Immigrants from Yemen vs Immigrants from Russia 6th Grade
COMPARE
Immigrants from Yemen
Immigrants from Russia
6th Grade
6th Grade Comparison
Immigrants from Yemen
Immigrants from Russia
94.1%
6TH GRADE
0.0/ 100
METRIC RATING
341st/ 347
METRIC RANK
97.1%
6TH GRADE
67.6/ 100
METRIC RATING
157th/ 347
METRIC RANK
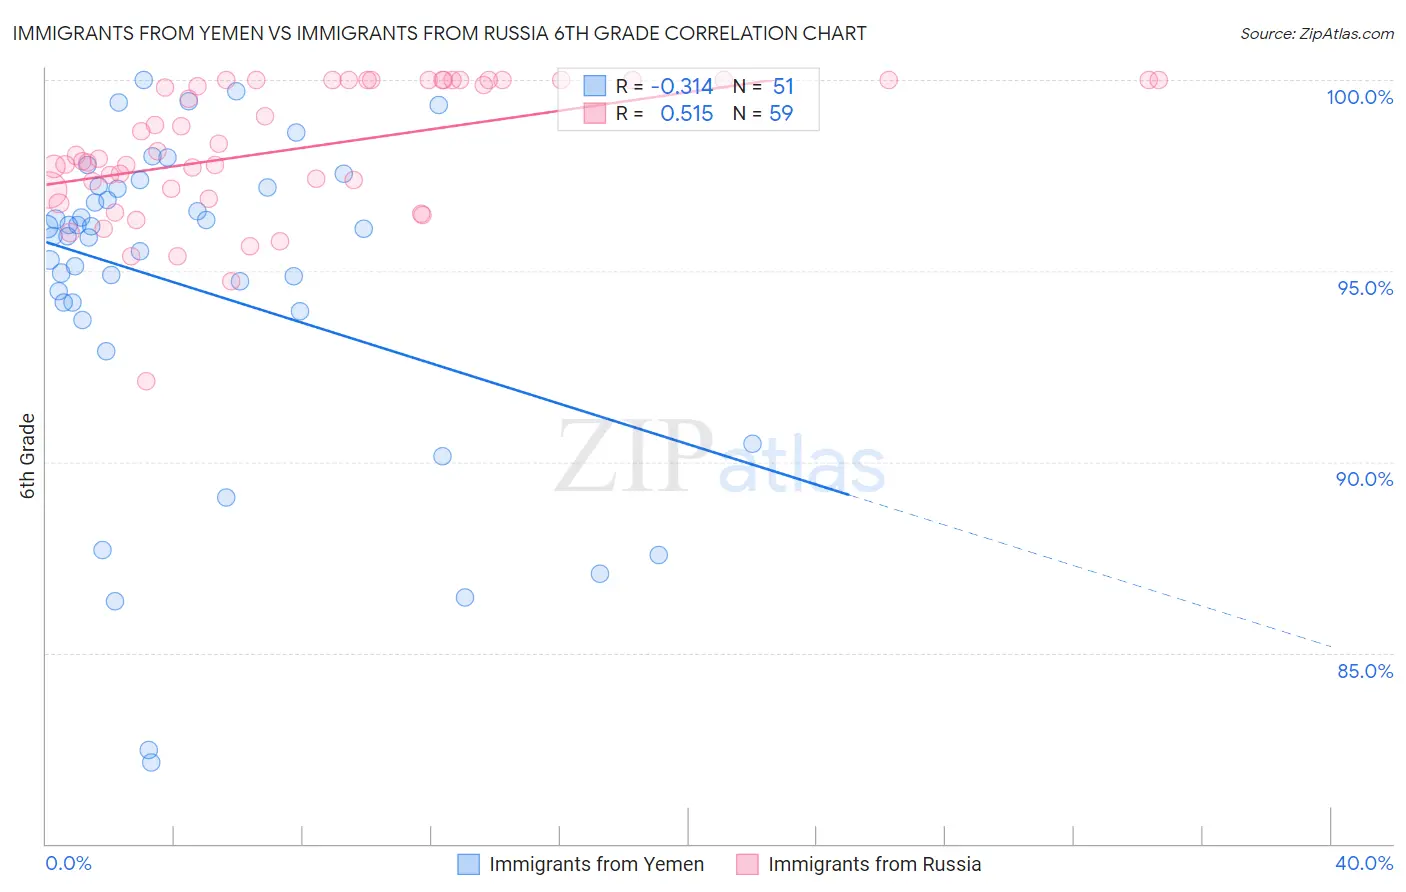
Immigrants from Yemen vs Immigrants from Russia 6th Grade Correlation Chart
The statistical analysis conducted on geographies consisting of 82,433,611 people shows a mild negative correlation between the proportion of Immigrants from Yemen and percentage of population with at least 6th grade education in the United States with a correlation coefficient (R) of -0.314 and weighted average of 94.1%. Similarly, the statistical analysis conducted on geographies consisting of 347,948,494 people shows a substantial positive correlation between the proportion of Immigrants from Russia and percentage of population with at least 6th grade education in the United States with a correlation coefficient (R) of 0.515 and weighted average of 97.1%, a difference of 3.2%.
6th Grade Correlation Summary
| Measurement | Immigrants from Yemen | Immigrants from Russia |
| Minimum | 82.1% | 92.1% |
| Maximum | 100.0% | 100.0% |
| Range | 17.9% | 7.9% |
| Mean | 94.6% | 98.2% |
| Median | 95.9% | 98.0% |
| Interquartile 25% (IQ1) | 93.9% | 97.1% |
| Interquartile 75% (IQ3) | 97.2% | 100.0% |
| Interquartile Range (IQR) | 3.2% | 2.9% |
| Standard Deviation (Sample) | 4.3% | 1.8% |
| Standard Deviation (Population) | 4.2% | 1.8% |
Similar Demographics by 6th Grade
Demographics Similar to Immigrants from Yemen by 6th Grade
In terms of 6th grade, the demographic groups most similar to Immigrants from Yemen are Immigrants from Central America (94.0%, a difference of 0.10%), Guatemalan (94.2%, a difference of 0.11%), Immigrants from Mexico (93.9%, a difference of 0.16%), Immigrants from Guatemala (93.9%, a difference of 0.17%), and Salvadoran (93.9%, a difference of 0.17%).
| Demographics | Rating | Rank | 6th Grade |
| Immigrants | Latin America | 0.0 /100 | #333 | Tragic 94.7% |
| Immigrants | Azores | 0.0 /100 | #334 | Tragic 94.7% |
| Mexicans | 0.0 /100 | #335 | Tragic 94.6% |
| Immigrants | Dominican Republic | 0.0 /100 | #336 | Tragic 94.6% |
| Central Americans | 0.0 /100 | #337 | Tragic 94.5% |
| Immigrants | Cabo Verde | 0.0 /100 | #338 | Tragic 94.4% |
| Yakama | 0.0 /100 | #339 | Tragic 94.3% |
| Guatemalans | 0.0 /100 | #340 | Tragic 94.2% |
| Immigrants | Yemen | 0.0 /100 | #341 | Tragic 94.1% |
| Immigrants | Central America | 0.0 /100 | #342 | Tragic 94.0% |
| Immigrants | Mexico | 0.0 /100 | #343 | Tragic 93.9% |
| Immigrants | Guatemala | 0.0 /100 | #344 | Tragic 93.9% |
| Salvadorans | 0.0 /100 | #345 | Tragic 93.9% |
| Spanish American Indians | 0.0 /100 | #346 | Tragic 93.6% |
| Immigrants | El Salvador | 0.0 /100 | #347 | Tragic 93.6% |
Demographics Similar to Immigrants from Russia by 6th Grade
In terms of 6th grade, the demographic groups most similar to Immigrants from Russia are Alsatian (97.1%, a difference of 0.010%), Soviet Union (97.2%, a difference of 0.020%), Ute (97.1%, a difference of 0.020%), Immigrants from Iran (97.1%, a difference of 0.020%), and Kenyan (97.1%, a difference of 0.020%).
| Demographics | Rating | Rank | 6th Grade |
| Immigrants | Bosnia and Herzegovina | 74.8 /100 | #150 | Good 97.2% |
| French American Indians | 74.0 /100 | #151 | Good 97.2% |
| Immigrants | Jordan | 73.0 /100 | #152 | Good 97.2% |
| Immigrants | Eastern Europe | 72.6 /100 | #153 | Good 97.2% |
| Soviet Union | 71.5 /100 | #154 | Good 97.2% |
| Ute | 71.1 /100 | #155 | Good 97.1% |
| Alsatians | 69.8 /100 | #156 | Good 97.1% |
| Immigrants | Russia | 67.6 /100 | #157 | Good 97.1% |
| Immigrants | Iran | 63.3 /100 | #158 | Good 97.1% |
| Kenyans | 62.9 /100 | #159 | Good 97.1% |
| Ugandans | 62.2 /100 | #160 | Good 97.1% |
| Immigrants | Belarus | 60.4 /100 | #161 | Good 97.1% |
| Marshallese | 60.2 /100 | #162 | Good 97.1% |
| Albanians | 57.8 /100 | #163 | Average 97.1% |
| Immigrants | Korea | 57.7 /100 | #164 | Average 97.1% |