Immigrants from Yemen vs Immigrants from Sweden 6th Grade
COMPARE
Immigrants from Yemen
Immigrants from Sweden
6th Grade
6th Grade Comparison
Immigrants from Yemen
Immigrants from Sweden
94.1%
6TH GRADE
0.0/ 100
METRIC RATING
341st/ 347
METRIC RANK
97.5%
6TH GRADE
98.6/ 100
METRIC RATING
97th/ 347
METRIC RANK
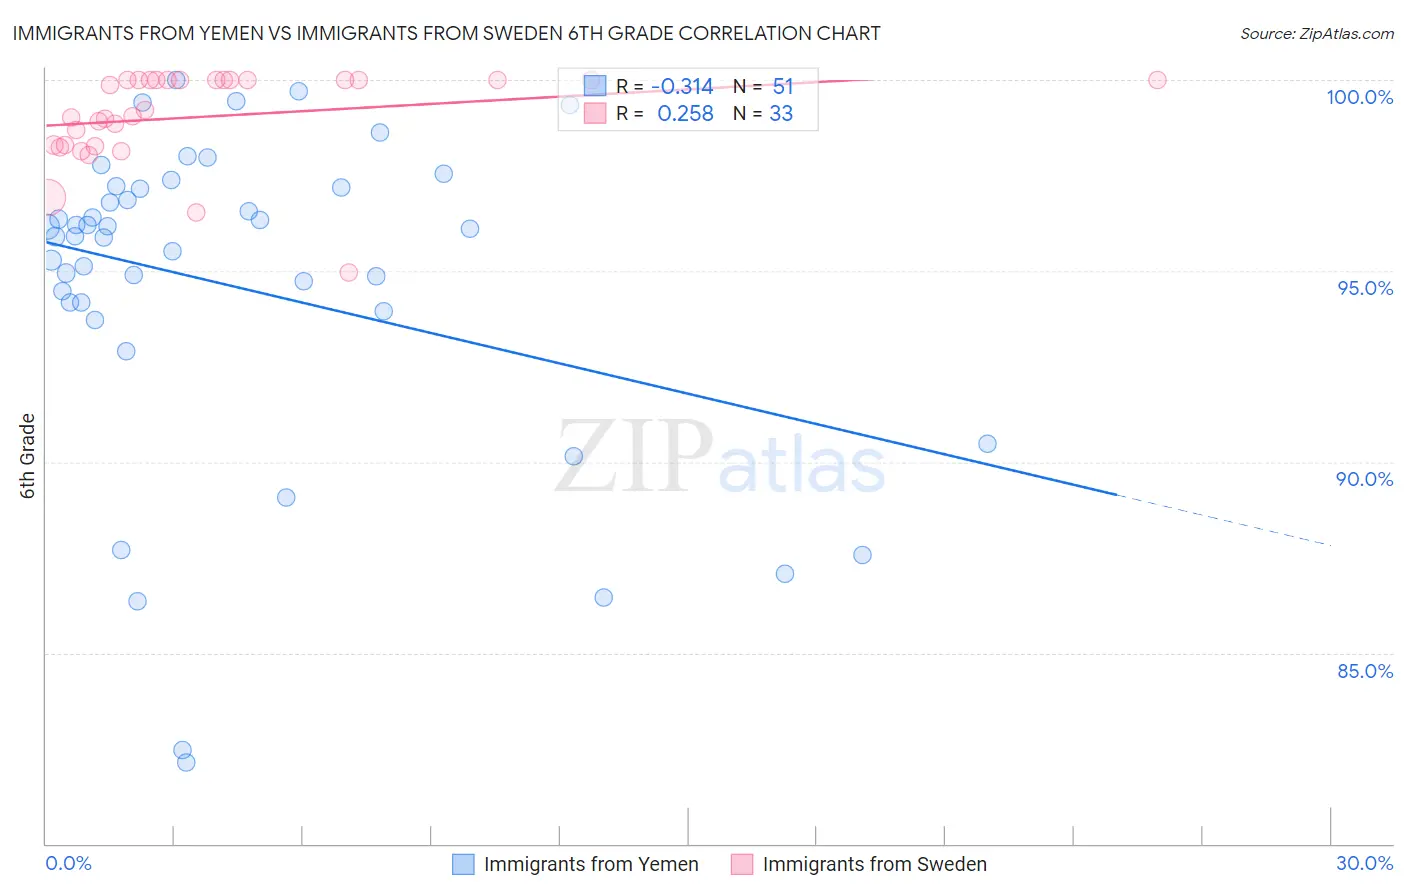
Immigrants from Yemen vs Immigrants from Sweden 6th Grade Correlation Chart
The statistical analysis conducted on geographies consisting of 82,433,611 people shows a mild negative correlation between the proportion of Immigrants from Yemen and percentage of population with at least 6th grade education in the United States with a correlation coefficient (R) of -0.314 and weighted average of 94.1%. Similarly, the statistical analysis conducted on geographies consisting of 164,737,092 people shows a weak positive correlation between the proportion of Immigrants from Sweden and percentage of population with at least 6th grade education in the United States with a correlation coefficient (R) of 0.258 and weighted average of 97.5%, a difference of 3.6%.
6th Grade Correlation Summary
| Measurement | Immigrants from Yemen | Immigrants from Sweden |
| Minimum | 82.1% | 95.0% |
| Maximum | 100.0% | 100.0% |
| Range | 17.9% | 5.0% |
| Mean | 94.6% | 99.0% |
| Median | 95.9% | 99.2% |
| Interquartile 25% (IQ1) | 93.9% | 98.3% |
| Interquartile 75% (IQ3) | 97.2% | 100.0% |
| Interquartile Range (IQR) | 3.2% | 1.7% |
| Standard Deviation (Sample) | 4.3% | 1.2% |
| Standard Deviation (Population) | 4.2% | 1.2% |
Similar Demographics by 6th Grade
Demographics Similar to Immigrants from Yemen by 6th Grade
In terms of 6th grade, the demographic groups most similar to Immigrants from Yemen are Immigrants from Central America (94.0%, a difference of 0.10%), Guatemalan (94.2%, a difference of 0.11%), Immigrants from Mexico (93.9%, a difference of 0.16%), Immigrants from Guatemala (93.9%, a difference of 0.17%), and Salvadoran (93.9%, a difference of 0.17%).
| Demographics | Rating | Rank | 6th Grade |
| Immigrants | Latin America | 0.0 /100 | #333 | Tragic 94.7% |
| Immigrants | Azores | 0.0 /100 | #334 | Tragic 94.7% |
| Mexicans | 0.0 /100 | #335 | Tragic 94.6% |
| Immigrants | Dominican Republic | 0.0 /100 | #336 | Tragic 94.6% |
| Central Americans | 0.0 /100 | #337 | Tragic 94.5% |
| Immigrants | Cabo Verde | 0.0 /100 | #338 | Tragic 94.4% |
| Yakama | 0.0 /100 | #339 | Tragic 94.3% |
| Guatemalans | 0.0 /100 | #340 | Tragic 94.2% |
| Immigrants | Yemen | 0.0 /100 | #341 | Tragic 94.1% |
| Immigrants | Central America | 0.0 /100 | #342 | Tragic 94.0% |
| Immigrants | Mexico | 0.0 /100 | #343 | Tragic 93.9% |
| Immigrants | Guatemala | 0.0 /100 | #344 | Tragic 93.9% |
| Salvadorans | 0.0 /100 | #345 | Tragic 93.9% |
| Spanish American Indians | 0.0 /100 | #346 | Tragic 93.6% |
| Immigrants | El Salvador | 0.0 /100 | #347 | Tragic 93.6% |
Demographics Similar to Immigrants from Sweden by 6th Grade
In terms of 6th grade, the demographic groups most similar to Immigrants from Sweden are Cree (97.5%, a difference of 0.0%), Cypriot (97.5%, a difference of 0.0%), Immigrants from Ireland (97.5%, a difference of 0.0%), Immigrants from Germany (97.5%, a difference of 0.0%), and Pueblo (97.5%, a difference of 0.010%).
| Demographics | Rating | Rank | 6th Grade |
| Pueblo | 98.8 /100 | #90 | Exceptional 97.5% |
| Immigrants | Western Europe | 98.8 /100 | #91 | Exceptional 97.5% |
| Romanians | 98.7 /100 | #92 | Exceptional 97.5% |
| Cree | 98.7 /100 | #93 | Exceptional 97.5% |
| Cypriots | 98.7 /100 | #94 | Exceptional 97.5% |
| Immigrants | Ireland | 98.7 /100 | #95 | Exceptional 97.5% |
| Immigrants | Germany | 98.6 /100 | #96 | Exceptional 97.5% |
| Immigrants | Sweden | 98.6 /100 | #97 | Exceptional 97.5% |
| Immigrants | Denmark | 98.5 /100 | #98 | Exceptional 97.5% |
| Yugoslavians | 98.5 /100 | #99 | Exceptional 97.5% |
| Turks | 98.3 /100 | #100 | Exceptional 97.5% |
| South Africans | 98.2 /100 | #101 | Exceptional 97.5% |
| Choctaw | 98.0 /100 | #102 | Exceptional 97.5% |
| Bhutanese | 98.0 /100 | #103 | Exceptional 97.5% |
| German Russians | 97.9 /100 | #104 | Exceptional 97.5% |