Macedonian vs Immigrants from Russia 6th Grade
COMPARE
Macedonian
Immigrants from Russia
6th Grade
6th Grade Comparison
Macedonians
Immigrants from Russia
97.6%
6TH GRADE
99.4/ 100
METRIC RATING
72nd/ 347
METRIC RANK
97.1%
6TH GRADE
67.6/ 100
METRIC RATING
157th/ 347
METRIC RANK
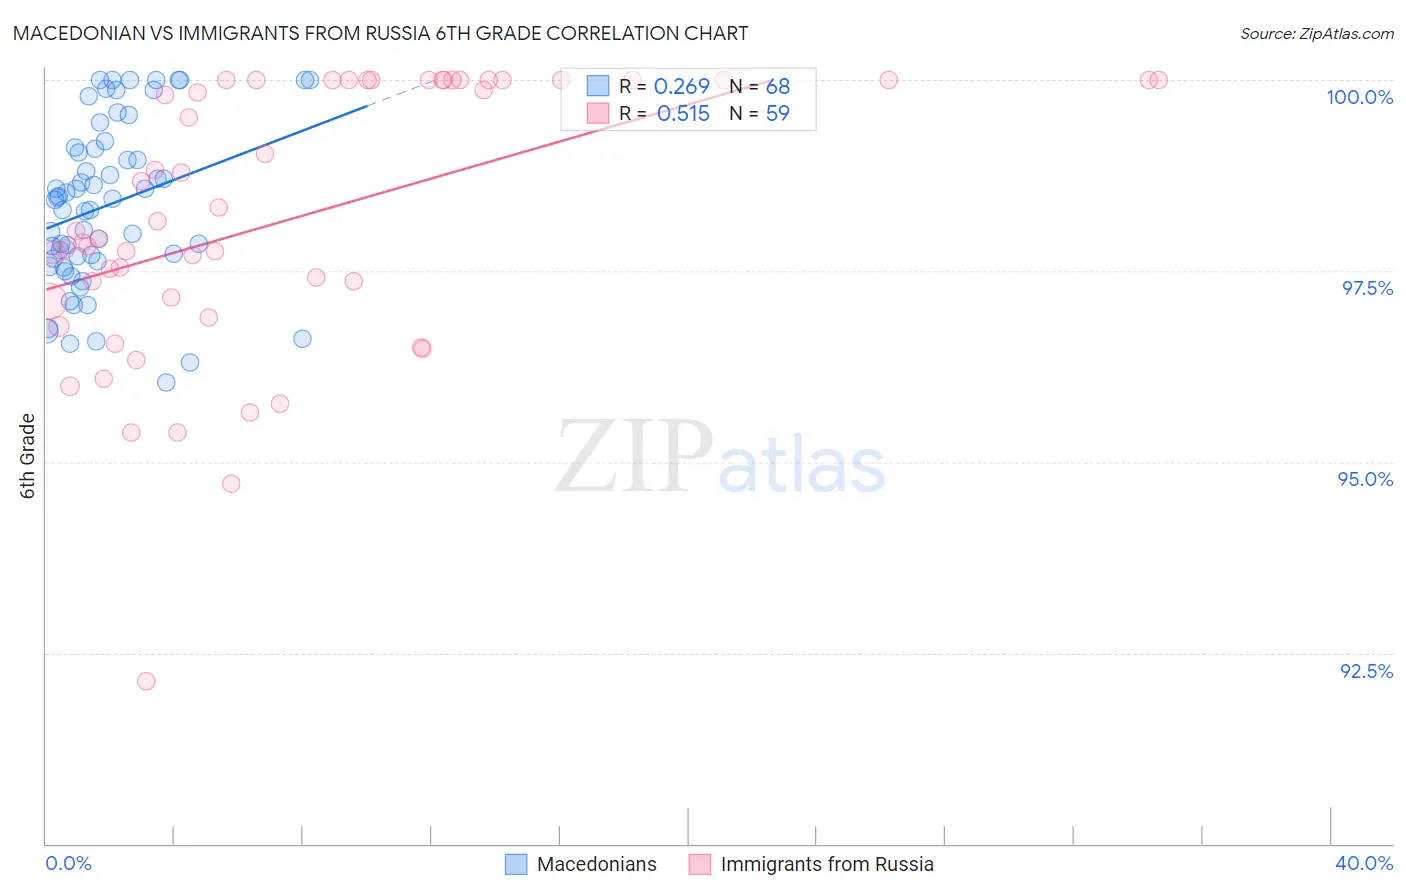
Macedonian vs Immigrants from Russia 6th Grade Correlation Chart
The statistical analysis conducted on geographies consisting of 132,592,860 people shows a weak positive correlation between the proportion of Macedonians and percentage of population with at least 6th grade education in the United States with a correlation coefficient (R) of 0.269 and weighted average of 97.6%. Similarly, the statistical analysis conducted on geographies consisting of 347,948,494 people shows a substantial positive correlation between the proportion of Immigrants from Russia and percentage of population with at least 6th grade education in the United States with a correlation coefficient (R) of 0.515 and weighted average of 97.1%, a difference of 0.50%.
6th Grade Correlation Summary
| Measurement | Macedonian | Immigrants from Russia |
| Minimum | 96.0% | 92.1% |
| Maximum | 100.0% | 100.0% |
| Range | 4.0% | 7.9% |
| Mean | 98.4% | 98.2% |
| Median | 98.4% | 98.0% |
| Interquartile 25% (IQ1) | 97.6% | 97.1% |
| Interquartile 75% (IQ3) | 99.1% | 100.0% |
| Interquartile Range (IQR) | 1.5% | 2.9% |
| Standard Deviation (Sample) | 1.1% | 1.8% |
| Standard Deviation (Population) | 1.1% | 1.8% |
Similar Demographics by 6th Grade
Demographics Similar to Macedonians by 6th Grade
In terms of 6th grade, the demographic groups most similar to Macedonians are Cherokee (97.6%, a difference of 0.0%), Chickasaw (97.6%, a difference of 0.010%), Immigrants from Netherlands (97.6%, a difference of 0.010%), Ukrainian (97.6%, a difference of 0.010%), and Immigrants from England (97.6%, a difference of 0.010%).
| Demographics | Rating | Rank | 6th Grade |
| Immigrants | Northern Europe | 99.6 /100 | #65 | Exceptional 97.7% |
| New Zealanders | 99.6 /100 | #66 | Exceptional 97.7% |
| Kiowa | 99.6 /100 | #67 | Exceptional 97.7% |
| Immigrants | Austria | 99.6 /100 | #68 | Exceptional 97.7% |
| Iranians | 99.6 /100 | #69 | Exceptional 97.6% |
| Cajuns | 99.5 /100 | #70 | Exceptional 97.6% |
| Chickasaw | 99.5 /100 | #71 | Exceptional 97.6% |
| Macedonians | 99.4 /100 | #72 | Exceptional 97.6% |
| Cherokee | 99.4 /100 | #73 | Exceptional 97.6% |
| Immigrants | Netherlands | 99.4 /100 | #74 | Exceptional 97.6% |
| Ukrainians | 99.4 /100 | #75 | Exceptional 97.6% |
| Immigrants | England | 99.4 /100 | #76 | Exceptional 97.6% |
| Immigrants | Lithuania | 99.3 /100 | #77 | Exceptional 97.6% |
| Icelanders | 99.3 /100 | #78 | Exceptional 97.6% |
| Immigrants | India | 99.3 /100 | #79 | Exceptional 97.6% |
Demographics Similar to Immigrants from Russia by 6th Grade
In terms of 6th grade, the demographic groups most similar to Immigrants from Russia are Alsatian (97.1%, a difference of 0.010%), Soviet Union (97.2%, a difference of 0.020%), Ute (97.1%, a difference of 0.020%), Immigrants from Iran (97.1%, a difference of 0.020%), and Kenyan (97.1%, a difference of 0.020%).
| Demographics | Rating | Rank | 6th Grade |
| Immigrants | Bosnia and Herzegovina | 74.8 /100 | #150 | Good 97.2% |
| French American Indians | 74.0 /100 | #151 | Good 97.2% |
| Immigrants | Jordan | 73.0 /100 | #152 | Good 97.2% |
| Immigrants | Eastern Europe | 72.6 /100 | #153 | Good 97.2% |
| Soviet Union | 71.5 /100 | #154 | Good 97.2% |
| Ute | 71.1 /100 | #155 | Good 97.1% |
| Alsatians | 69.8 /100 | #156 | Good 97.1% |
| Immigrants | Russia | 67.6 /100 | #157 | Good 97.1% |
| Immigrants | Iran | 63.3 /100 | #158 | Good 97.1% |
| Kenyans | 62.9 /100 | #159 | Good 97.1% |
| Ugandans | 62.2 /100 | #160 | Good 97.1% |
| Immigrants | Belarus | 60.4 /100 | #161 | Good 97.1% |
| Marshallese | 60.2 /100 | #162 | Good 97.1% |
| Albanians | 57.8 /100 | #163 | Average 97.1% |
| Immigrants | Korea | 57.7 /100 | #164 | Average 97.1% |