Immigrants from Yemen vs Immigrants from Central America Kindergarten
COMPARE
Immigrants from Yemen
Immigrants from Central America
Kindergarten
Kindergarten Comparison
Immigrants from Yemen
Immigrants from Central America
95.9%
KINDERGARTEN
0.0/ 100
METRIC RATING
346th/ 347
METRIC RANK
96.4%
KINDERGARTEN
0.0/ 100
METRIC RATING
340th/ 347
METRIC RANK
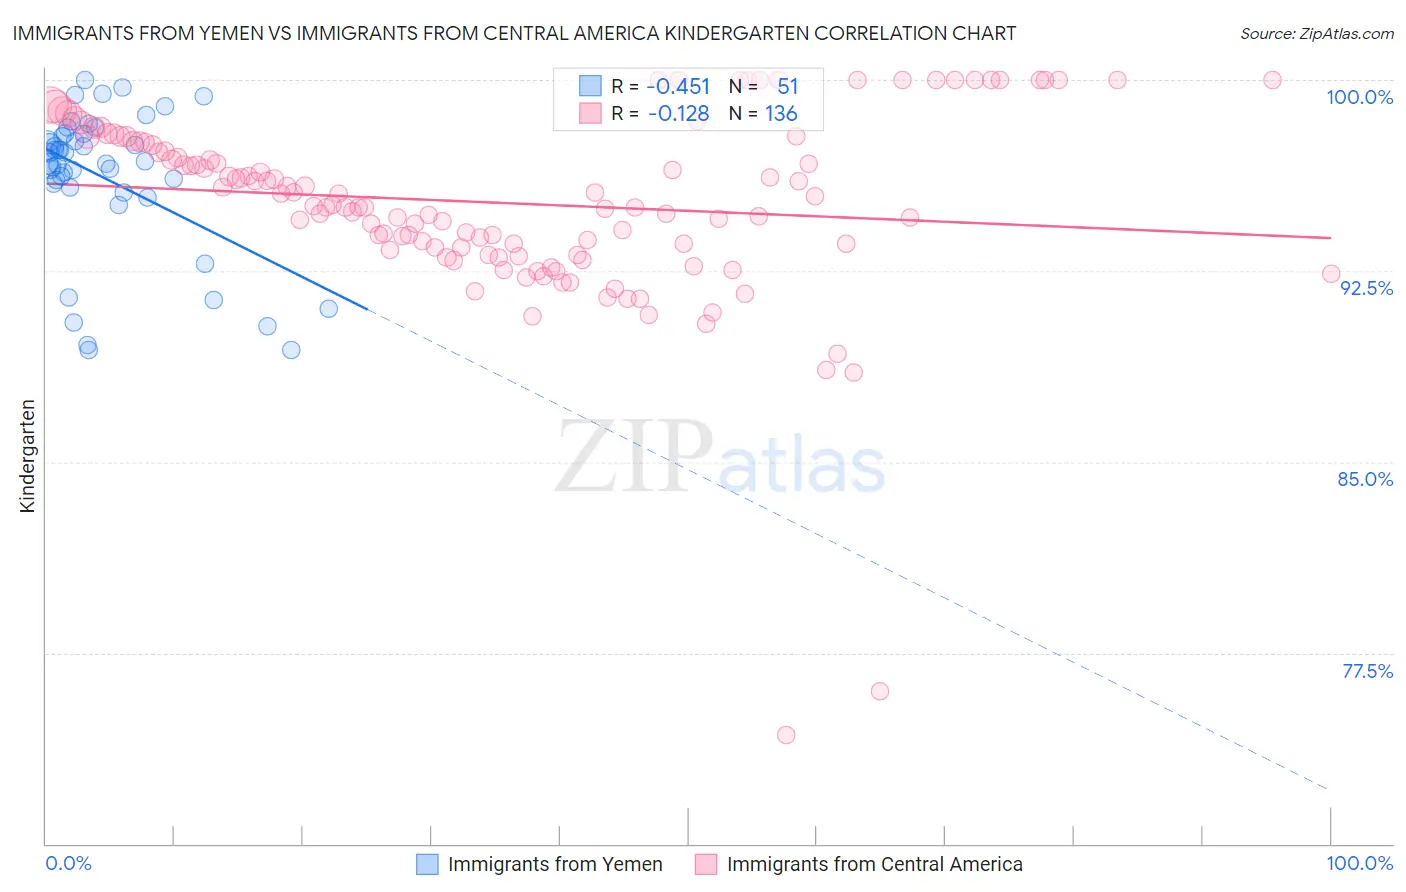
Immigrants from Yemen vs Immigrants from Central America Kindergarten Correlation Chart
The statistical analysis conducted on geographies consisting of 82,433,611 people shows a moderate negative correlation between the proportion of Immigrants from Yemen and percentage of population with at least kindergarten education in the United States with a correlation coefficient (R) of -0.451 and weighted average of 95.9%. Similarly, the statistical analysis conducted on geographies consisting of 536,554,221 people shows a poor negative correlation between the proportion of Immigrants from Central America and percentage of population with at least kindergarten education in the United States with a correlation coefficient (R) of -0.128 and weighted average of 96.4%, a difference of 0.55%.
Kindergarten Correlation Summary
| Measurement | Immigrants from Yemen | Immigrants from Central America |
| Minimum | 89.4% | 74.3% |
| Maximum | 100.0% | 100.0% |
| Range | 10.6% | 25.7% |
| Mean | 96.2% | 95.2% |
| Median | 96.8% | 95.1% |
| Interquartile 25% (IQ1) | 95.8% | 93.4% |
| Interquartile 75% (IQ3) | 97.9% | 97.6% |
| Interquartile Range (IQR) | 2.1% | 4.2% |
| Standard Deviation (Sample) | 2.8% | 3.7% |
| Standard Deviation (Population) | 2.8% | 3.7% |
Demographics Similar to Immigrants from Yemen and Immigrants from Central America by Kindergarten
In terms of kindergarten, the demographic groups most similar to Immigrants from Yemen are Spanish American Indian (95.8%, a difference of 0.070%), Nepalese (96.2%, a difference of 0.34%), Immigrants from El Salvador (96.2%, a difference of 0.34%), Salvadoran (96.3%, a difference of 0.49%), and Immigrants from Mexico (96.4%, a difference of 0.52%). Similarly, the demographic groups most similar to Immigrants from Central America are Immigrants from Cabo Verde (96.4%, a difference of 0.0%), Immigrants from Guatemala (96.4%, a difference of 0.030%), Immigrants from Mexico (96.4%, a difference of 0.030%), Salvadoran (96.3%, a difference of 0.060%), and Immigrants from Fiji (96.5%, a difference of 0.11%).
| Demographics | Rating | Rank | Kindergarten |
| Immigrants | Latin America | 0.0 /100 | #328 | Tragic 96.7% |
| Immigrants | Vietnam | 0.0 /100 | #329 | Tragic 96.7% |
| Japanese | 0.0 /100 | #330 | Tragic 96.7% |
| Immigrants | Armenia | 0.0 /100 | #331 | Tragic 96.6% |
| Yakama | 0.0 /100 | #332 | Tragic 96.6% |
| Central Americans | 0.0 /100 | #333 | Tragic 96.6% |
| Immigrants | Dominican Republic | 0.0 /100 | #334 | Tragic 96.6% |
| Bangladeshis | 0.0 /100 | #335 | Tragic 96.6% |
| Guatemalans | 0.0 /100 | #336 | Tragic 96.5% |
| Immigrants | Cambodia | 0.0 /100 | #337 | Tragic 96.5% |
| Immigrants | Fiji | 0.0 /100 | #338 | Tragic 96.5% |
| Immigrants | Guatemala | 0.0 /100 | #339 | Tragic 96.4% |
| Immigrants | Central America | 0.0 /100 | #340 | Tragic 96.4% |
| Immigrants | Cabo Verde | 0.0 /100 | #341 | Tragic 96.4% |
| Immigrants | Mexico | 0.0 /100 | #342 | Tragic 96.4% |
| Salvadorans | 0.0 /100 | #343 | Tragic 96.3% |
| Nepalese | 0.0 /100 | #344 | Tragic 96.2% |
| Immigrants | El Salvador | 0.0 /100 | #345 | Tragic 96.2% |
| Immigrants | Yemen | 0.0 /100 | #346 | Tragic 95.9% |
| Spanish American Indians | 0.0 /100 | #347 | Tragic 95.8% |