Immigrants from Switzerland vs Arab No Schooling Completed
COMPARE
Immigrants from Switzerland
Arab
No Schooling Completed
No Schooling Completed Comparison
Immigrants from Switzerland
Arabs
1.8%
NO SCHOOLING COMPLETED
97.9/ 100
METRIC RATING
102nd/ 347
METRIC RANK
2.1%
NO SCHOOLING COMPLETED
46.4/ 100
METRIC RATING
175th/ 347
METRIC RANK
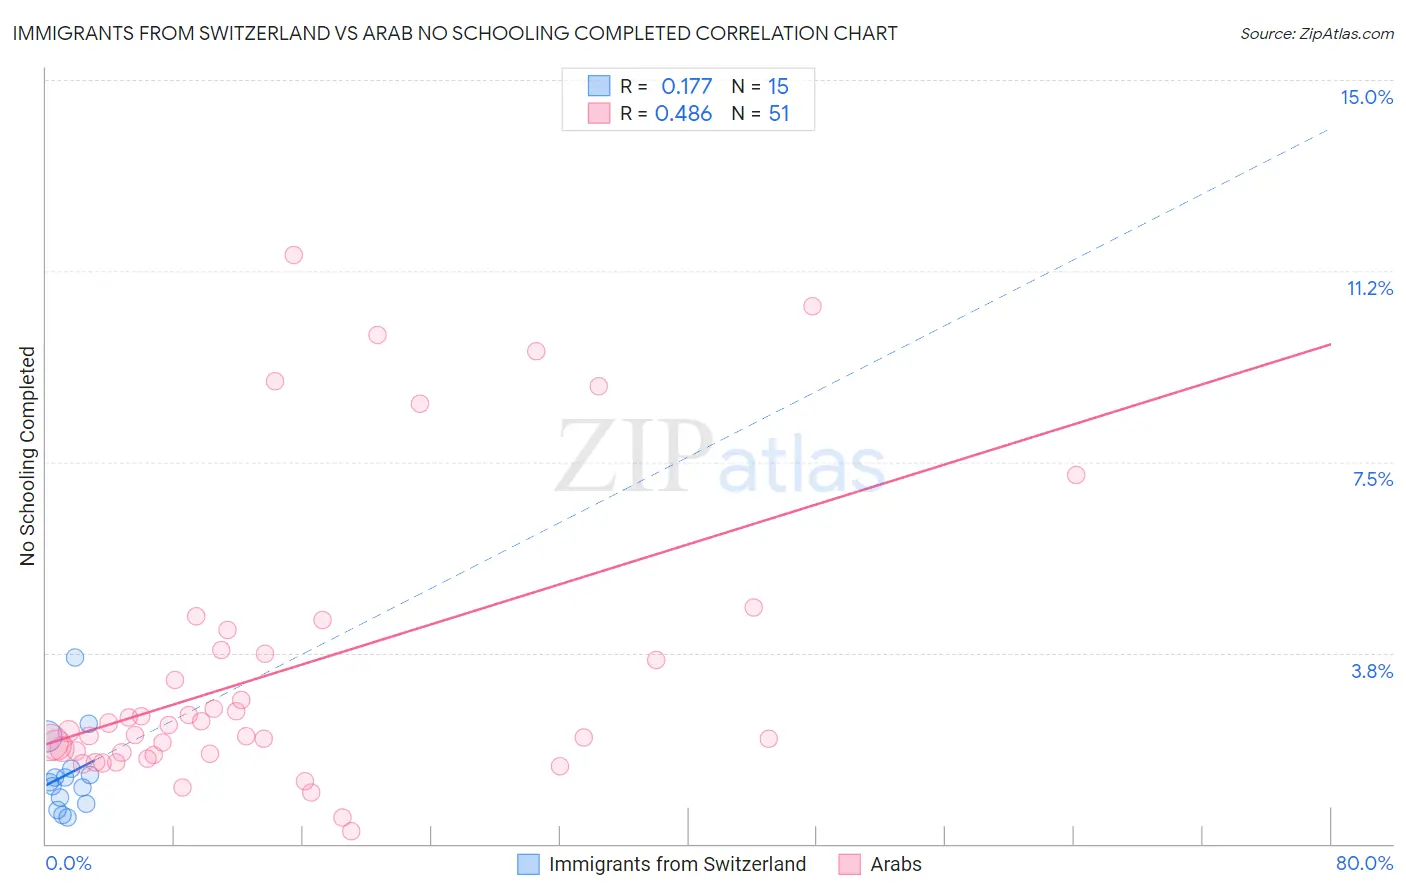
Immigrants from Switzerland vs Arab No Schooling Completed Correlation Chart
The statistical analysis conducted on geographies consisting of 147,132,968 people shows a poor positive correlation between the proportion of Immigrants from Switzerland and percentage of population with no schooling in the United States with a correlation coefficient (R) of 0.177 and weighted average of 1.8%. Similarly, the statistical analysis conducted on geographies consisting of 479,384,082 people shows a moderate positive correlation between the proportion of Arabs and percentage of population with no schooling in the United States with a correlation coefficient (R) of 0.486 and weighted average of 2.1%, a difference of 15.4%.
No Schooling Completed Correlation Summary
| Measurement | Immigrants from Switzerland | Arab |
| Minimum | 0.51% | 0.23% |
| Maximum | 3.7% | 11.6% |
| Range | 3.1% | 11.3% |
| Mean | 1.4% | 3.4% |
| Median | 1.2% | 2.2% |
| Interquartile 25% (IQ1) | 0.79% | 1.8% |
| Interquartile 75% (IQ3) | 1.5% | 3.8% |
| Interquartile Range (IQR) | 0.68% | 2.0% |
| Standard Deviation (Sample) | 0.82% | 2.8% |
| Standard Deviation (Population) | 0.79% | 2.8% |
Similar Demographics by No Schooling Completed
Demographics Similar to Immigrants from Switzerland by No Schooling Completed
In terms of no schooling completed, the demographic groups most similar to Immigrants from Switzerland are Immigrants from Czechoslovakia (1.8%, a difference of 0.0%), Basque (1.8%, a difference of 0.050%), Immigrants from Singapore (1.8%, a difference of 0.30%), Choctaw (1.8%, a difference of 0.50%), and Thai (1.8%, a difference of 0.63%).
| Demographics | Rating | Rank | No Schooling Completed |
| Puget Sound Salish | 98.5 /100 | #95 | Exceptional 1.8% |
| Bhutanese | 98.4 /100 | #96 | Exceptional 1.8% |
| Immigrants | Ireland | 98.4 /100 | #97 | Exceptional 1.8% |
| Iranians | 98.2 /100 | #98 | Exceptional 1.8% |
| Choctaw | 98.1 /100 | #99 | Exceptional 1.8% |
| Immigrants | Singapore | 98.0 /100 | #100 | Exceptional 1.8% |
| Immigrants | Czechoslovakia | 97.9 /100 | #101 | Exceptional 1.8% |
| Immigrants | Switzerland | 97.9 /100 | #102 | Exceptional 1.8% |
| Basques | 97.9 /100 | #103 | Exceptional 1.8% |
| Thais | 97.5 /100 | #104 | Exceptional 1.8% |
| German Russians | 97.5 /100 | #105 | Exceptional 1.8% |
| Immigrants | France | 97.3 /100 | #106 | Exceptional 1.8% |
| Yugoslavians | 97.2 /100 | #107 | Exceptional 1.8% |
| Okinawans | 97.1 /100 | #108 | Exceptional 1.8% |
| Immigrants | Saudi Arabia | 96.8 /100 | #109 | Exceptional 1.9% |
Demographics Similar to Arabs by No Schooling Completed
In terms of no schooling completed, the demographic groups most similar to Arabs are Panamanian (2.1%, a difference of 0.17%), Arapaho (2.1%, a difference of 0.19%), Pakistani (2.1%, a difference of 0.23%), Immigrants from Kazakhstan (2.1%, a difference of 0.29%), and Portuguese (2.1%, a difference of 0.35%).
| Demographics | Rating | Rank | No Schooling Completed |
| Cheyenne | 58.6 /100 | #168 | Average 2.1% |
| Apache | 56.7 /100 | #169 | Average 2.1% |
| Argentineans | 56.0 /100 | #170 | Average 2.1% |
| Immigrants | Poland | 55.2 /100 | #171 | Average 2.1% |
| Immigrants | Argentina | 52.7 /100 | #172 | Average 2.1% |
| Immigrants | Belarus | 51.8 /100 | #173 | Average 2.1% |
| Immigrants | Micronesia | 50.0 /100 | #174 | Average 2.1% |
| Arabs | 46.4 /100 | #175 | Average 2.1% |
| Panamanians | 45.2 /100 | #176 | Average 2.1% |
| Arapaho | 45.0 /100 | #177 | Average 2.1% |
| Pakistanis | 44.7 /100 | #178 | Average 2.1% |
| Immigrants | Kazakhstan | 44.3 /100 | #179 | Average 2.1% |
| Portuguese | 43.9 /100 | #180 | Average 2.1% |
| Immigrants | Taiwan | 42.6 /100 | #181 | Average 2.1% |
| French American Indians | 42.2 /100 | #182 | Average 2.1% |