Guatemalan vs Arab No Schooling Completed
COMPARE
Guatemalan
Arab
No Schooling Completed
No Schooling Completed Comparison
Guatemalans
Arabs
3.5%
NO SCHOOLING COMPLETED
0.0/ 100
METRIC RATING
334th/ 347
METRIC RANK
2.1%
NO SCHOOLING COMPLETED
46.4/ 100
METRIC RATING
175th/ 347
METRIC RANK
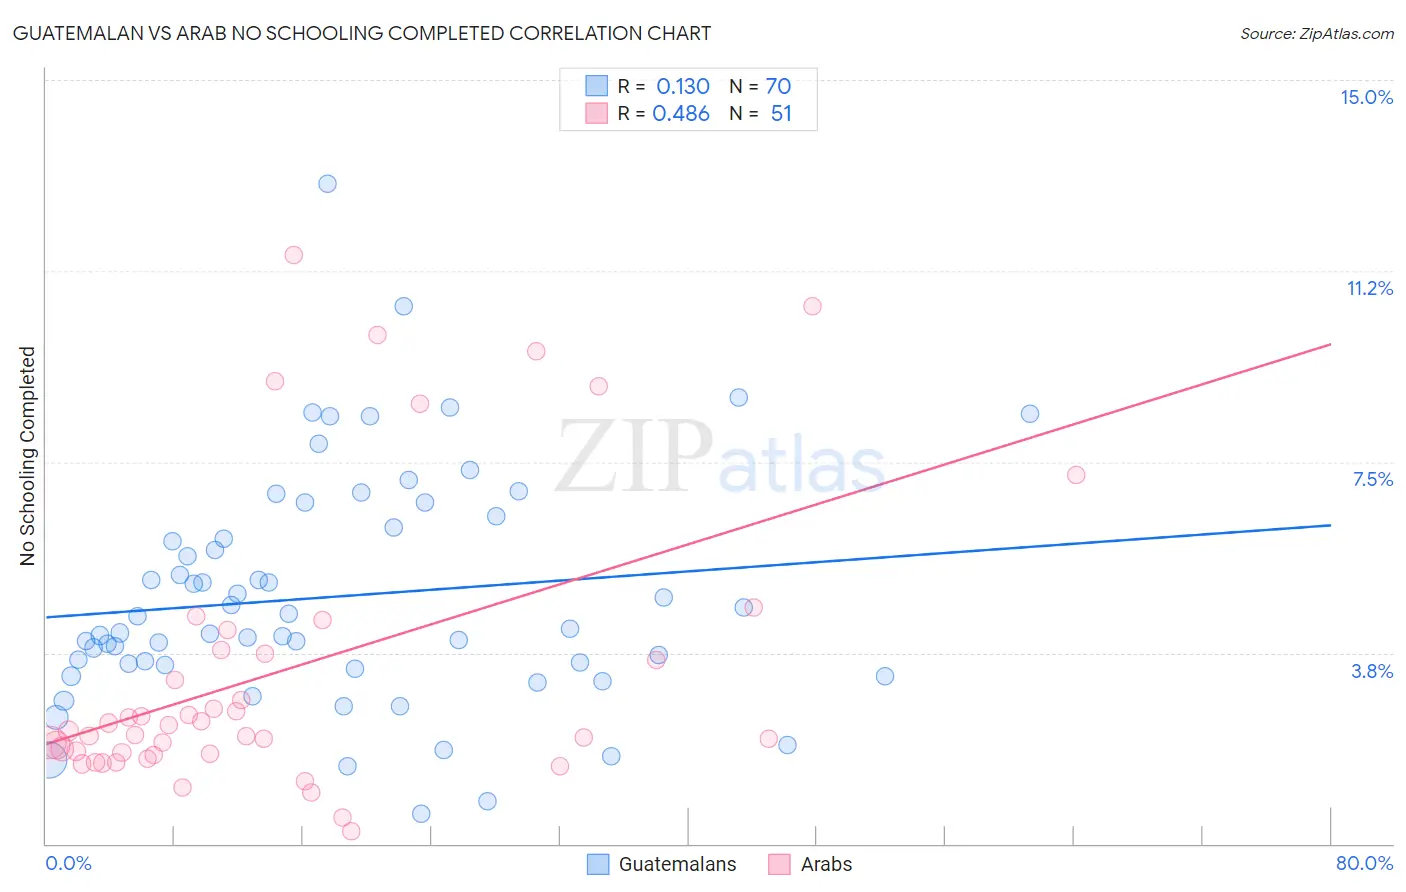
Guatemalan vs Arab No Schooling Completed Correlation Chart
The statistical analysis conducted on geographies consisting of 406,309,514 people shows a poor positive correlation between the proportion of Guatemalans and percentage of population with no schooling in the United States with a correlation coefficient (R) of 0.130 and weighted average of 3.5%. Similarly, the statistical analysis conducted on geographies consisting of 479,384,082 people shows a moderate positive correlation between the proportion of Arabs and percentage of population with no schooling in the United States with a correlation coefficient (R) of 0.486 and weighted average of 2.1%, a difference of 64.6%.
No Schooling Completed Correlation Summary
| Measurement | Guatemalan | Arab |
| Minimum | 0.59% | 0.23% |
| Maximum | 13.0% | 11.6% |
| Range | 12.4% | 11.3% |
| Mean | 4.9% | 3.4% |
| Median | 4.2% | 2.2% |
| Interquartile 25% (IQ1) | 3.5% | 1.8% |
| Interquartile 75% (IQ3) | 6.2% | 3.8% |
| Interquartile Range (IQR) | 2.7% | 2.0% |
| Standard Deviation (Sample) | 2.3% | 2.8% |
| Standard Deviation (Population) | 2.3% | 2.8% |
Similar Demographics by No Schooling Completed
Demographics Similar to Guatemalans by No Schooling Completed
In terms of no schooling completed, the demographic groups most similar to Guatemalans are Immigrants from Cambodia (3.5%, a difference of 1.0%), Immigrants from Fiji (3.5%, a difference of 1.4%), Immigrants from Dominican Republic (3.4%, a difference of 1.8%), Central American (3.4%, a difference of 1.8%), and Immigrants from Cabo Verde (3.5%, a difference of 2.1%).
| Demographics | Rating | Rank | No Schooling Completed |
| Immigrants | Latin America | 0.0 /100 | #327 | Tragic 3.3% |
| Mexicans | 0.0 /100 | #328 | Tragic 3.3% |
| Immigrants | Vietnam | 0.0 /100 | #329 | Tragic 3.3% |
| Immigrants | Armenia | 0.0 /100 | #330 | Tragic 3.3% |
| Japanese | 0.0 /100 | #331 | Tragic 3.3% |
| Central Americans | 0.0 /100 | #332 | Tragic 3.4% |
| Immigrants | Dominican Republic | 0.0 /100 | #333 | Tragic 3.4% |
| Guatemalans | 0.0 /100 | #334 | Tragic 3.5% |
| Immigrants | Cambodia | 0.0 /100 | #335 | Tragic 3.5% |
| Immigrants | Fiji | 0.0 /100 | #336 | Tragic 3.5% |
| Immigrants | Cabo Verde | 0.0 /100 | #337 | Tragic 3.5% |
| Bangladeshis | 0.0 /100 | #338 | Tragic 3.5% |
| Yakama | 0.0 /100 | #339 | Tragic 3.6% |
| Immigrants | Guatemala | 0.0 /100 | #340 | Tragic 3.6% |
| Immigrants | Central America | 0.0 /100 | #341 | Tragic 3.6% |
Demographics Similar to Arabs by No Schooling Completed
In terms of no schooling completed, the demographic groups most similar to Arabs are Panamanian (2.1%, a difference of 0.17%), Arapaho (2.1%, a difference of 0.19%), Pakistani (2.1%, a difference of 0.23%), Immigrants from Kazakhstan (2.1%, a difference of 0.29%), and Portuguese (2.1%, a difference of 0.35%).
| Demographics | Rating | Rank | No Schooling Completed |
| Cheyenne | 58.6 /100 | #168 | Average 2.1% |
| Apache | 56.7 /100 | #169 | Average 2.1% |
| Argentineans | 56.0 /100 | #170 | Average 2.1% |
| Immigrants | Poland | 55.2 /100 | #171 | Average 2.1% |
| Immigrants | Argentina | 52.7 /100 | #172 | Average 2.1% |
| Immigrants | Belarus | 51.8 /100 | #173 | Average 2.1% |
| Immigrants | Micronesia | 50.0 /100 | #174 | Average 2.1% |
| Arabs | 46.4 /100 | #175 | Average 2.1% |
| Panamanians | 45.2 /100 | #176 | Average 2.1% |
| Arapaho | 45.0 /100 | #177 | Average 2.1% |
| Pakistanis | 44.7 /100 | #178 | Average 2.1% |
| Immigrants | Kazakhstan | 44.3 /100 | #179 | Average 2.1% |
| Portuguese | 43.9 /100 | #180 | Average 2.1% |
| Immigrants | Taiwan | 42.6 /100 | #181 | Average 2.1% |
| French American Indians | 42.2 /100 | #182 | Average 2.1% |