Immigrants from Western Europe vs Sri Lankan Nursery School

COMPARE

Immigrants from Western Europe
Race
Ancestry
AfghanAfricanAlaska NativeAlaskan AthabascanAlbanianAleutAlsatianAmericanApacheArabArapahoArgentineanArmenianAssyrian/Chaldean/SyriacAustralianAustrianBahamianBangladeshiBarbadianBasqueBelgianBelizeanBermudanBhutaneseBlackfeetBolivianBrazilianBritishBritish West IndianBulgarianBurmeseCajunCambodianCanadianCape VerdeanCarpatho RusynCelticCentral AmericanCentral American IndianCherokeeCheyenneChickasawChileanChineseChippewaChoctawColombianColvilleComancheCosta RicanCreeCreekCroatianCrowCubanCypriotCzechCzechoslovakianDanishDelawareDominicanDutchDutch West IndianEastern EuropeanEcuadorianEgyptianEnglishEstonianEthiopianEuropeanFijianFilipinoFinnishFrenchFrench American IndianFrench CanadianGermanGerman RussianGhanaianGreekGuamanian/ChamorroGuatemalanGuyaneseHaitianHmongHonduranHopiHoumaHungarianIcelanderIndian (Asian)IndonesianInupiatIranianIraqiIrishIroquoisIsraeliItalianJamaicanJapaneseJordanianKenyanKiowaKoreanLaotianLatvianLebaneseLiberianLithuanianLumbeeLuxembourgerMacedonianMalaysianMalteseMarshalleseMenomineeMexicanMexican American IndianMongolianMoroccanNative HawaiianNavajoNepaleseNew ZealanderNicaraguanNigerianNorthern EuropeanNorwegianOkinawanOsageOttawaPaiutePakistaniPalestinianPanamanianParaguayanPennsylvania GermanPeruvianPimaPolishPortuguesePotawatomiPuebloPuerto RicanPuget Sound SalishRomanianRussianSalvadoranSamoanScandinavianScotch-IrishScottishSeminoleSenegaleseSerbianShoshoneSierra LeoneanSiouxSlavicSlovakSloveneSomaliSouth AfricanSouth AmericanSouth American IndianSoviet UnionSpaniardSpanishSpanish AmericanSpanish American IndianSubsaharan AfricanSudaneseSwedishSwissSyrianTaiwaneseThaiTlingit-HaidaTohono O'OdhamTonganTrinidadian and TobagonianTsimshianTurkishU.S. Virgin IslanderUgandanUkrainianUruguayanUteVenezuelanVietnameseWelshWest IndianYakamaYaquiYugoslavianYumanYup'ikZimbabwean
Immigration
NonimmigrantsImmigrantsAfghanistanAfricaAlbaniaArgentinaArmeniaAsiaAustraliaAustriaBahamasBangladeshBarbadosBelarusBelgiumBelizeBoliviaBosnia and HerzegovinaBrazilBulgariaBurma/MyanmarCabo VerdeCambodiaCameroonCanadaCaribbeanCentral AmericaChileChinaColombiaCongoCosta RicaCroatiaCubaCzechoslovakiaDenmarkDominicaDominican RepublicEastern AfricaEastern AsiaEastern EuropeEcuadorEgyptEl SalvadorEnglandEritreaEthiopiaEuropeFijiFranceGermanyGhanaGreeceGrenadaGuatemalaGuyanaHaitiHondurasHong KongHungaryIndiaIndonesiaIranIraqIrelandIsraelItalyJamaicaJapanJordanKazakhstanKenyaKoreaKuwaitLaosLatin AmericaLatviaLebanonLiberiaLithuaniaMalaysiaMexicoMicronesiaMiddle AfricaMoldovaMoroccoNepalNetherlandsNicaraguaNigeriaNorth AmericaNorth MacedoniaNorthern AfricaNorthern EuropeNorwayOceaniaPakistanPanamaPeruPhilippinesPolandPortugalRomaniaRussiaSaudi ArabiaScotlandSenegalSerbiaSierra LeoneSingaporeSomaliaSouth AfricaSouth AmericaSouth Central AsiaSouth Eastern AsiaSouthern EuropeSpainSri LankaSt. Vincent and the GrenadinesSudanSwedenSwitzerlandSyriaTaiwanThailandTrinidad and TobagoTurkeyUgandaUkraineUruguayUzbekistanVenezuelaVietnamWest IndiesWestern AfricaWestern AsiaWestern EuropeYemenZaireZimbabweAzores
Sri Lankan
Race
Ancestry
AfghanAfricanAlaska NativeAlaskan AthabascanAlbanianAleutAlsatianAmericanApacheArabArapahoArgentineanArmenianAssyrian/Chaldean/SyriacAustralianAustrianBahamianBangladeshiBarbadianBasqueBelgianBelizeanBermudanBhutaneseBlackfeetBolivianBrazilianBritishBritish West IndianBulgarianBurmeseCajunCambodianCanadianCape VerdeanCarpatho RusynCelticCentral AmericanCentral American IndianCherokeeCheyenneChickasawChileanChineseChippewaChoctawColombianColvilleComancheCosta RicanCreeCreekCroatianCrowCubanCypriotCzechCzechoslovakianDanishDelawareDominicanDutchDutch West IndianEastern EuropeanEcuadorianEgyptianEnglishEstonianEthiopianEuropeanFijianFilipinoFinnishFrenchFrench American IndianFrench CanadianGermanGerman RussianGhanaianGreekGuamanian/ChamorroGuatemalanGuyaneseHaitianHmongHonduranHopiHoumaHungarianIcelanderIndian (Asian)IndonesianInupiatIranianIraqiIrishIroquoisIsraeliItalianJamaicanJapaneseJordanianKenyanKiowaKoreanLaotianLatvianLebaneseLiberianLithuanianLumbeeLuxembourgerMacedonianMalaysianMalteseMarshalleseMenomineeMexicanMexican American IndianMongolianMoroccanNative HawaiianNavajoNepaleseNew ZealanderNicaraguanNigerianNorthern EuropeanNorwegianOkinawanOsageOttawaPaiutePakistaniPalestinianPanamanianParaguayanPennsylvania GermanPeruvianPimaPolishPortuguesePotawatomiPuebloPuerto RicanPuget Sound SalishRomanianRussianSalvadoranSamoanScandinavianScotch-IrishScottishSeminoleSenegaleseSerbianShoshoneSierra LeoneanSiouxSlavicSlovakSloveneSomaliSouth AfricanSouth AmericanSouth American IndianSoviet UnionSpaniardSpanishSpanish AmericanSpanish American IndianSri LankanSubsaharan AfricanSudaneseSwedishSwissSyrianTaiwaneseThaiTlingit-HaidaTohono O'OdhamTonganTrinidadian and TobagonianTsimshianTurkishU.S. Virgin IslanderUgandanUkrainianUruguayanUteVenezuelanVietnameseWelshWest IndianYakamaYaquiYugoslavianYumanYup'ikZimbabwean
Immigration
NonimmigrantsImmigrantsAfghanistanAfricaAlbaniaArgentinaArmeniaAsiaAustraliaAustriaBahamasBangladeshBarbadosBelarusBelgiumBelizeBoliviaBosnia and HerzegovinaBrazilBulgariaBurma/MyanmarCabo VerdeCambodiaCameroonCanadaCaribbeanCentral AmericaChileChinaColombiaCongoCosta RicaCroatiaCubaCzechoslovakiaDenmarkDominicaDominican RepublicEastern AfricaEastern AsiaEastern EuropeEcuadorEgyptEl SalvadorEnglandEritreaEthiopiaEuropeFijiFranceGermanyGhanaGreeceGrenadaGuatemalaGuyanaHaitiHondurasHong KongHungaryIndiaIndonesiaIranIraqIrelandIsraelItalyJamaicaJapanJordanKazakhstanKenyaKoreaKuwaitLaosLatin AmericaLatviaLebanonLiberiaLithuaniaMalaysiaMexicoMicronesiaMiddle AfricaMoldovaMoroccoNepalNetherlandsNicaraguaNigeriaNorth AmericaNorth MacedoniaNorthern AfricaNorthern EuropeNorwayOceaniaPakistanPanamaPeruPhilippinesPolandPortugalRomaniaRussiaSaudi ArabiaScotlandSenegalSerbiaSierra LeoneSingaporeSomaliaSouth AfricaSouth AmericaSouth Central AsiaSouth Eastern AsiaSouthern EuropeSpainSri LankaSt. Vincent and the GrenadinesSudanSwedenSwitzerlandSyriaTaiwanThailandTrinidad and TobagoTurkeyUgandaUkraineUruguayUzbekistanVenezuelaVietnamWest IndiesWestern AfricaWestern AsiaYemenZaireZimbabweAzores
Nursery School
Income
Poverty
Unemployment
Labor Participation
Family Structure
Vehicle Availability
Education Level
Disability

Nursery School Comparison

Immigrants from Western Europe

Sri Lankans

Exceptional
Tragic
98.3%
NURSERY SCHOOL
98.8/ 100
METRIC RATING
90th/ 347
METRIC RANK
97.0%
NURSERY SCHOOL
0.0/ 100
METRIC RATING
312th/ 347
METRIC RANK

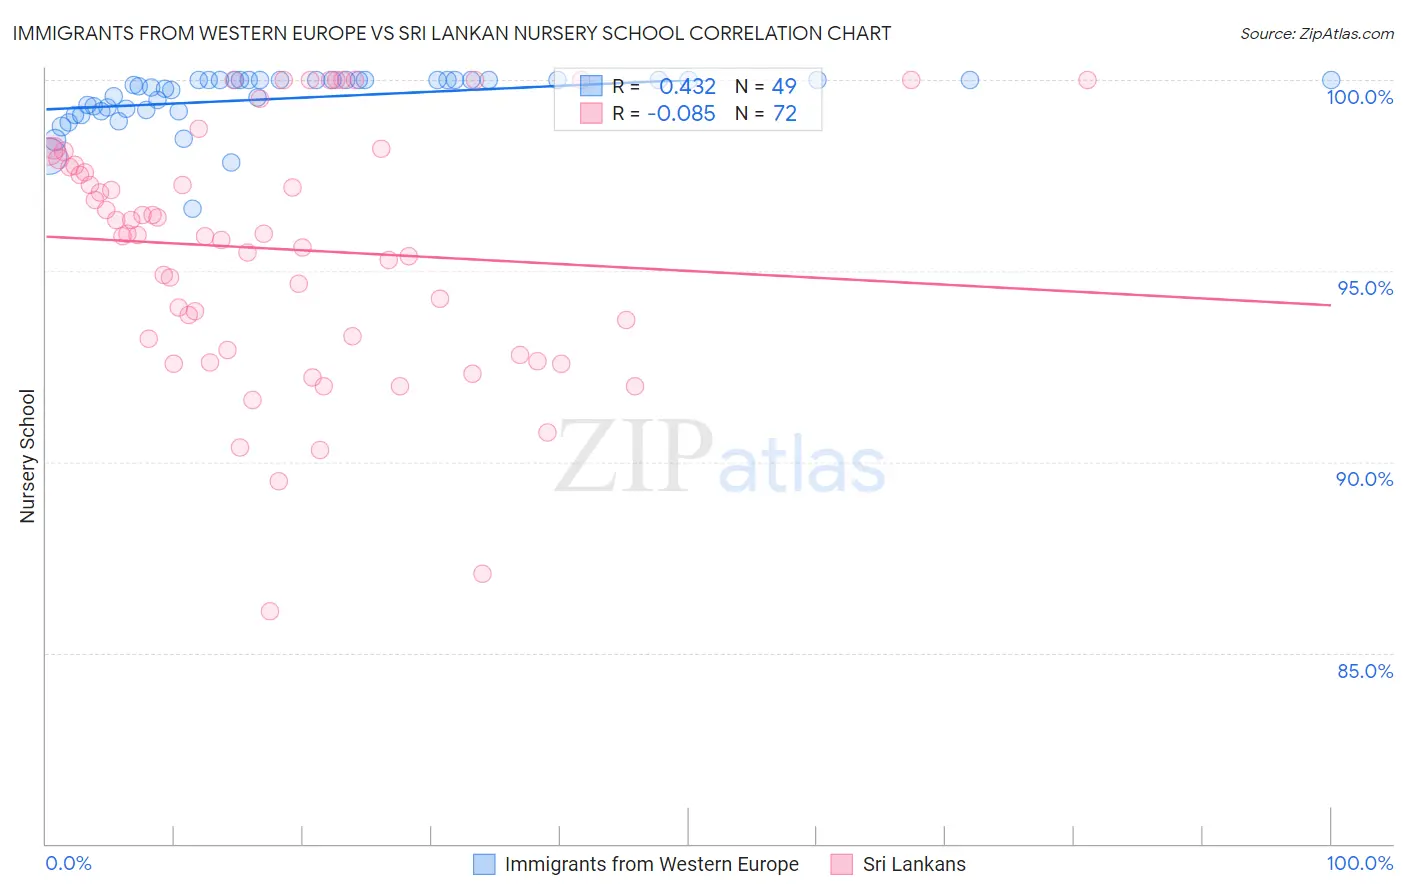
Immigrants from Western Europe vs Sri Lankan Nursery School Correlation Chart

The statistical analysis conducted on geographies consisting of 494,080,297 people shows a moderate positive correlation between the proportion of Immigrants from Western Europe and percentage of population with at least nursery school education in the United States with a correlation coefficient (R) of 0.432 and weighted average of 98.3%. Similarly, the statistical analysis conducted on geographies consisting of 440,593,746 people shows a slight negative correlation between the proportion of Sri Lankans and percentage of population with at least nursery school education in the United States with a correlation coefficient (R) of -0.085 and weighted average of 97.0%, a difference of 1.4%.
Immigrants from Western Europe vs Sri Lankan Nursery School

Nursery School Correlation Summary

MeasurementImmigrants from Western EuropeSri Lankan
Minimum96.6%86.1%
Maximum100.0%100.0%
Range3.4%13.9%
Mean99.5%95.6%
Median99.9%96.0%
Interquartile 25% (IQ1)99.2%93.1%
Interquartile 75% (IQ3)100.0%97.8%
Interquartile Range (IQR)0.79%4.8%
Standard Deviation (Sample)0.71%3.2%
Standard Deviation (Population)0.70%3.2%

Similar Demographics by Nursery School

Demographics Similar to Immigrants from Western Europe by Nursery School

In terms of nursery school, the demographic groups most similar to Immigrants from Western Europe are Hopi (98.3%, a difference of 0.0%), Ukrainian (98.3%, a difference of 0.0%), Immigrants from South Africa (98.3%, a difference of 0.0%), Zimbabwean (98.3%, a difference of 0.0%), and Macedonian (98.3%, a difference of 0.0%).
DemographicsRating | RankNursery School
Osage
99.1
/100
|
#83
Exceptional
98.3%
Immigrants | Denmark
99.1
/100
|
#84
Exceptional
98.3%
Immigrants | Sweden
99.1
/100
|
#85
Exceptional
98.3%
Immigrants | Australia
99.0
/100
|
#86
Exceptional
98.3%
Hopi
98.9
/100
|
#87
Exceptional
98.3%
Ukrainians
98.9
/100
|
#88
Exceptional
98.3%
Immigrants | South Africa
98.8
/100
|
#89
Exceptional
98.3%
Immigrants | Western Europe
98.8
/100
|
#90
Exceptional
98.3%
Zimbabweans
98.8
/100
|
#91
Exceptional
98.3%
Macedonians
98.7
/100
|
#92
Exceptional
98.3%
Immigrants | India
98.7
/100
|
#93
Exceptional
98.3%
Immigrants | Germany
98.6
/100
|
#94
Exceptional
98.3%
South Africans
98.6
/100
|
#95
Exceptional
98.3%
Cypriots
98.3
/100
|
#96
Exceptional
98.3%
Immigrants | Nonimmigrants
98.3
/100
|
#97
Exceptional
98.3%

Demographics Similar to Sri Lankans by Nursery School

In terms of nursery school, the demographic groups most similar to Sri Lankans are Guyanese (97.0%, a difference of 0.0%), Immigrants from the Azores (97.0%, a difference of 0.0%), Immigrants from Somalia (97.0%, a difference of 0.010%), Honduran (97.0%, a difference of 0.020%), and Hispanic or Latino (97.0%, a difference of 0.030%).
DemographicsRating | RankNursery School
Somalis
0.0
/100
|
#305
Tragic
97.1%
Belizeans
0.0
/100
|
#306
Tragic
97.0%
Hispanics or Latinos
0.0
/100
|
#307
Tragic
97.0%
Immigrants | Haiti
0.0
/100
|
#308
Tragic
97.0%
Immigrants | Somalia
0.0
/100
|
#309
Tragic
97.0%
Guyanese
0.0
/100
|
#310
Tragic
97.0%
Immigrants | Azores
0.0
/100
|
#311
Tragic
97.0%
Sri Lankans
0.0
/100
|
#312
Tragic
97.0%
Hondurans
0.0
/100
|
#313
Tragic
97.0%
Cape Verdeans
0.0
/100
|
#314
Tragic
97.0%
Immigrants | Nicaragua
0.0
/100
|
#315
Tragic
96.9%
Immigrants | Belize
0.0
/100
|
#316
Tragic
96.9%
Immigrants | Ecuador
0.0
/100
|
#317
Tragic
96.9%
Immigrants | Guyana
0.0
/100
|
#318
Tragic
96.9%
Immigrants | Laos
0.0
/100
|
#319
Tragic
96.9%