European vs Sri Lankan Nursery School
COMPARE
European
Sri Lankan
Nursery School
Nursery School Comparison
Europeans
Sri Lankans
98.6%
NURSERY SCHOOL
100.0/ 100
METRIC RATING
30th/ 347
METRIC RANK
97.0%
NURSERY SCHOOL
0.0/ 100
METRIC RATING
312th/ 347
METRIC RANK
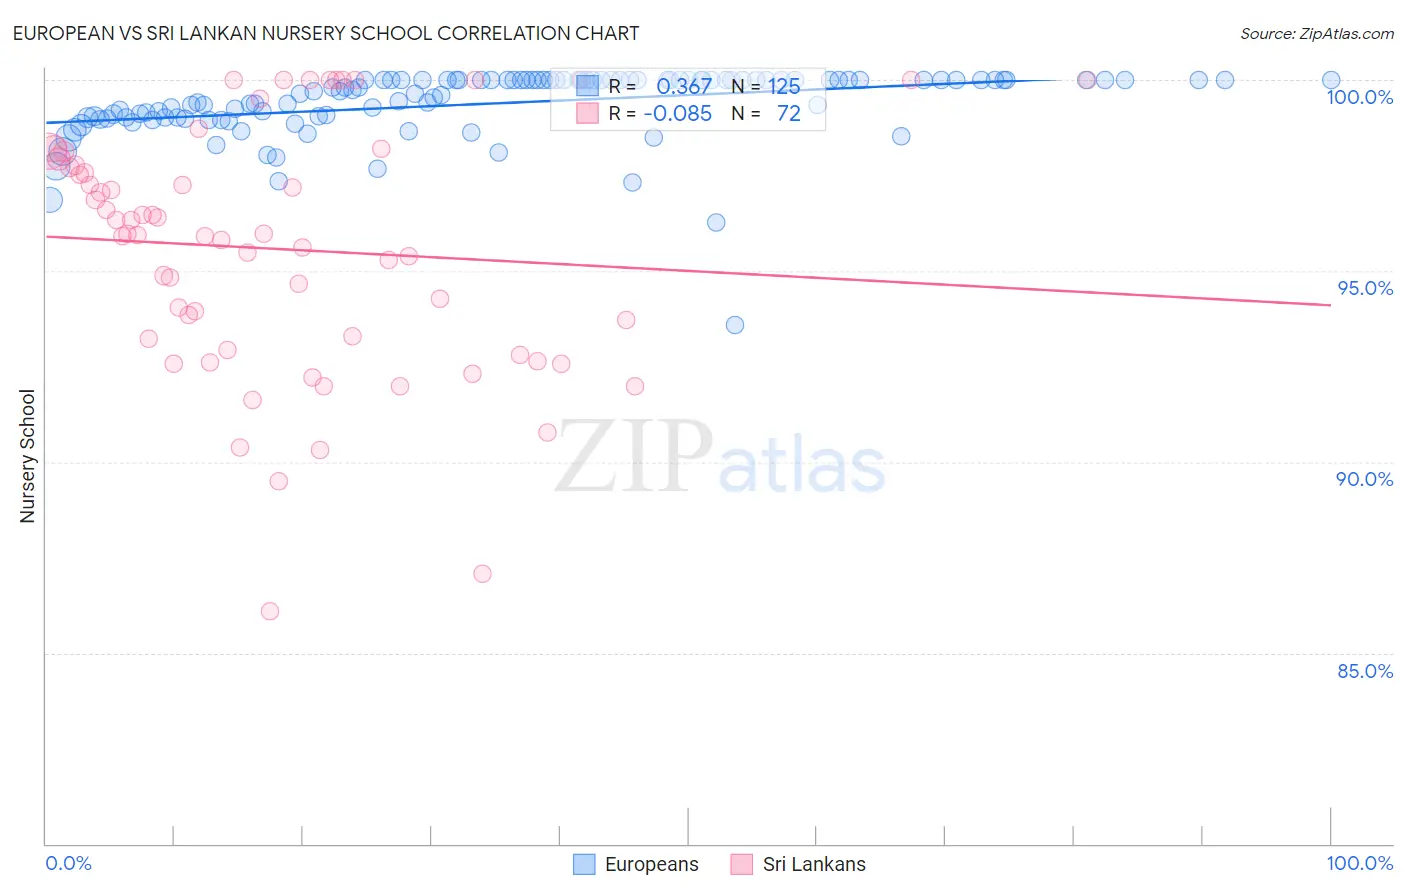
European vs Sri Lankan Nursery School Correlation Chart
The statistical analysis conducted on geographies consisting of 561,829,544 people shows a mild positive correlation between the proportion of Europeans and percentage of population with at least nursery school education in the United States with a correlation coefficient (R) of 0.367 and weighted average of 98.6%. Similarly, the statistical analysis conducted on geographies consisting of 440,593,746 people shows a slight negative correlation between the proportion of Sri Lankans and percentage of population with at least nursery school education in the United States with a correlation coefficient (R) of -0.085 and weighted average of 97.0%, a difference of 1.7%.
Nursery School Correlation Summary
| Measurement | European | Sri Lankan |
| Minimum | 93.6% | 86.1% |
| Maximum | 100.0% | 100.0% |
| Range | 6.4% | 13.9% |
| Mean | 99.4% | 95.6% |
| Median | 99.8% | 96.0% |
| Interquartile 25% (IQ1) | 99.0% | 93.1% |
| Interquartile 75% (IQ3) | 100.0% | 97.8% |
| Interquartile Range (IQR) | 0.98% | 4.8% |
| Standard Deviation (Sample) | 0.92% | 3.2% |
| Standard Deviation (Population) | 0.91% | 3.2% |
Similar Demographics by Nursery School
Demographics Similar to Europeans by Nursery School
In terms of nursery school, the demographic groups most similar to Europeans are French (98.6%, a difference of 0.0%), Czech (98.6%, a difference of 0.0%), French Canadian (98.6%, a difference of 0.0%), Croatian (98.6%, a difference of 0.010%), and Scandinavian (98.6%, a difference of 0.010%).
| Demographics | Rating | Rank | Nursery School |
| Poles | 100.0 /100 | #23 | Exceptional 98.6% |
| Danes | 100.0 /100 | #24 | Exceptional 98.6% |
| Scotch-Irish | 100.0 /100 | #25 | Exceptional 98.6% |
| Sioux | 100.0 /100 | #26 | Exceptional 98.6% |
| Arapaho | 100.0 /100 | #27 | Exceptional 98.6% |
| Croatians | 100.0 /100 | #28 | Exceptional 98.6% |
| French | 100.0 /100 | #29 | Exceptional 98.6% |
| Europeans | 100.0 /100 | #30 | Exceptional 98.6% |
| Czechs | 100.0 /100 | #31 | Exceptional 98.6% |
| French Canadians | 100.0 /100 | #32 | Exceptional 98.6% |
| Scandinavians | 100.0 /100 | #33 | Exceptional 98.6% |
| Chinese | 100.0 /100 | #34 | Exceptional 98.6% |
| Swiss | 100.0 /100 | #35 | Exceptional 98.6% |
| British | 100.0 /100 | #36 | Exceptional 98.5% |
| Lumbee | 99.9 /100 | #37 | Exceptional 98.5% |
Demographics Similar to Sri Lankans by Nursery School
In terms of nursery school, the demographic groups most similar to Sri Lankans are Guyanese (97.0%, a difference of 0.0%), Immigrants from the Azores (97.0%, a difference of 0.0%), Immigrants from Somalia (97.0%, a difference of 0.010%), Honduran (97.0%, a difference of 0.020%), and Hispanic or Latino (97.0%, a difference of 0.030%).
| Demographics | Rating | Rank | Nursery School |
| Somalis | 0.0 /100 | #305 | Tragic 97.1% |
| Belizeans | 0.0 /100 | #306 | Tragic 97.0% |
| Hispanics or Latinos | 0.0 /100 | #307 | Tragic 97.0% |
| Immigrants | Haiti | 0.0 /100 | #308 | Tragic 97.0% |
| Immigrants | Somalia | 0.0 /100 | #309 | Tragic 97.0% |
| Guyanese | 0.0 /100 | #310 | Tragic 97.0% |
| Immigrants | Azores | 0.0 /100 | #311 | Tragic 97.0% |
| Sri Lankans | 0.0 /100 | #312 | Tragic 97.0% |
| Hondurans | 0.0 /100 | #313 | Tragic 97.0% |
| Cape Verdeans | 0.0 /100 | #314 | Tragic 97.0% |
| Immigrants | Nicaragua | 0.0 /100 | #315 | Tragic 96.9% |
| Immigrants | Belize | 0.0 /100 | #316 | Tragic 96.9% |
| Immigrants | Ecuador | 0.0 /100 | #317 | Tragic 96.9% |
| Immigrants | Guyana | 0.0 /100 | #318 | Tragic 96.9% |
| Immigrants | Laos | 0.0 /100 | #319 | Tragic 96.9% |