Immigrants from Western Europe vs German Nursery School
COMPARE
Immigrants from Western Europe
German
Nursery School
Nursery School Comparison
Immigrants from Western Europe
Germans
98.3%
NURSERY SCHOOL
98.8/ 100
METRIC RATING
90th/ 347
METRIC RANK
98.7%
NURSERY SCHOOL
100.0/ 100
METRIC RATING
10th/ 347
METRIC RANK
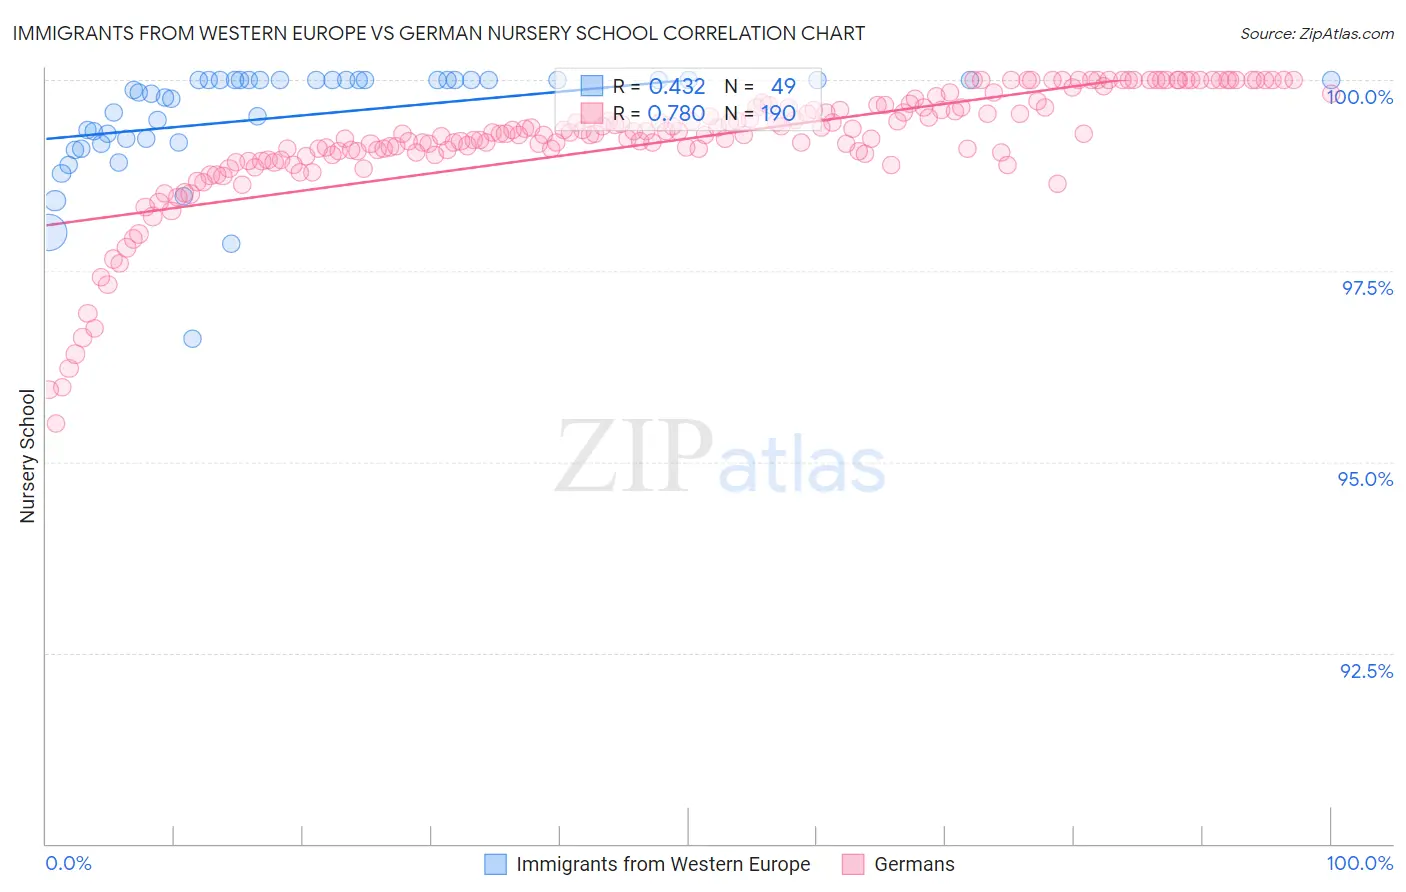
Immigrants from Western Europe vs German Nursery School Correlation Chart
The statistical analysis conducted on geographies consisting of 494,080,297 people shows a moderate positive correlation between the proportion of Immigrants from Western Europe and percentage of population with at least nursery school education in the United States with a correlation coefficient (R) of 0.432 and weighted average of 98.3%. Similarly, the statistical analysis conducted on geographies consisting of 581,302,427 people shows a strong positive correlation between the proportion of Germans and percentage of population with at least nursery school education in the United States with a correlation coefficient (R) of 0.780 and weighted average of 98.7%, a difference of 0.43%.
Nursery School Correlation Summary
| Measurement | Immigrants from Western Europe | German |
| Minimum | 96.6% | 95.5% |
| Maximum | 100.0% | 100.0% |
| Range | 3.4% | 4.5% |
| Mean | 99.5% | 99.2% |
| Median | 99.9% | 99.3% |
| Interquartile 25% (IQ1) | 99.2% | 99.0% |
| Interquartile 75% (IQ3) | 100.0% | 99.6% |
| Interquartile Range (IQR) | 0.79% | 0.61% |
| Standard Deviation (Sample) | 0.71% | 0.81% |
| Standard Deviation (Population) | 0.70% | 0.81% |
Similar Demographics by Nursery School
Demographics Similar to Immigrants from Western Europe by Nursery School
In terms of nursery school, the demographic groups most similar to Immigrants from Western Europe are Hopi (98.3%, a difference of 0.0%), Ukrainian (98.3%, a difference of 0.0%), Immigrants from South Africa (98.3%, a difference of 0.0%), Zimbabwean (98.3%, a difference of 0.0%), and Macedonian (98.3%, a difference of 0.0%).
| Demographics | Rating | Rank | Nursery School |
| Osage | 99.1 /100 | #83 | Exceptional 98.3% |
| Immigrants | Denmark | 99.1 /100 | #84 | Exceptional 98.3% |
| Immigrants | Sweden | 99.1 /100 | #85 | Exceptional 98.3% |
| Immigrants | Australia | 99.0 /100 | #86 | Exceptional 98.3% |
| Hopi | 98.9 /100 | #87 | Exceptional 98.3% |
| Ukrainians | 98.9 /100 | #88 | Exceptional 98.3% |
| Immigrants | South Africa | 98.8 /100 | #89 | Exceptional 98.3% |
| Immigrants | Western Europe | 98.8 /100 | #90 | Exceptional 98.3% |
| Zimbabweans | 98.8 /100 | #91 | Exceptional 98.3% |
| Macedonians | 98.7 /100 | #92 | Exceptional 98.3% |
| Immigrants | India | 98.7 /100 | #93 | Exceptional 98.3% |
| Immigrants | Germany | 98.6 /100 | #94 | Exceptional 98.3% |
| South Africans | 98.6 /100 | #95 | Exceptional 98.3% |
| Cypriots | 98.3 /100 | #96 | Exceptional 98.3% |
| Immigrants | Nonimmigrants | 98.3 /100 | #97 | Exceptional 98.3% |
Demographics Similar to Germans by Nursery School
In terms of nursery school, the demographic groups most similar to Germans are Slovak (98.7%, a difference of 0.0%), Tlingit-Haida (98.7%, a difference of 0.0%), Norwegian (98.7%, a difference of 0.020%), Slovene (98.7%, a difference of 0.020%), and Alaska Native (98.8%, a difference of 0.040%).
| Demographics | Rating | Rank | Nursery School |
| Welsh | 100.0 /100 | #3 | Exceptional 98.9% |
| Inupiat | 100.0 /100 | #4 | Exceptional 98.9% |
| Tsimshian | 100.0 /100 | #5 | Exceptional 98.9% |
| Alaskan Athabascans | 100.0 /100 | #6 | Exceptional 98.8% |
| Alaska Natives | 100.0 /100 | #7 | Exceptional 98.8% |
| Norwegians | 100.0 /100 | #8 | Exceptional 98.7% |
| Slovaks | 100.0 /100 | #9 | Exceptional 98.7% |
| Germans | 100.0 /100 | #10 | Exceptional 98.7% |
| Tlingit-Haida | 100.0 /100 | #11 | Exceptional 98.7% |
| Slovenes | 100.0 /100 | #12 | Exceptional 98.7% |
| English | 100.0 /100 | #13 | Exceptional 98.7% |
| Carpatho Rusyns | 100.0 /100 | #14 | Exceptional 98.7% |
| Swedes | 100.0 /100 | #15 | Exceptional 98.7% |
| Scottish | 100.0 /100 | #16 | Exceptional 98.7% |
| Aleuts | 100.0 /100 | #17 | Exceptional 98.7% |