Immigrants from Western Africa vs Swiss 4th Grade
COMPARE
Immigrants from Western Africa
Swiss
4th Grade
4th Grade Comparison
Immigrants from Western Africa
Swiss
96.9%
4TH GRADE
0.1/ 100
METRIC RATING
277th/ 347
METRIC RANK
98.2%
4TH GRADE
100.0/ 100
METRIC RATING
33rd/ 347
METRIC RANK
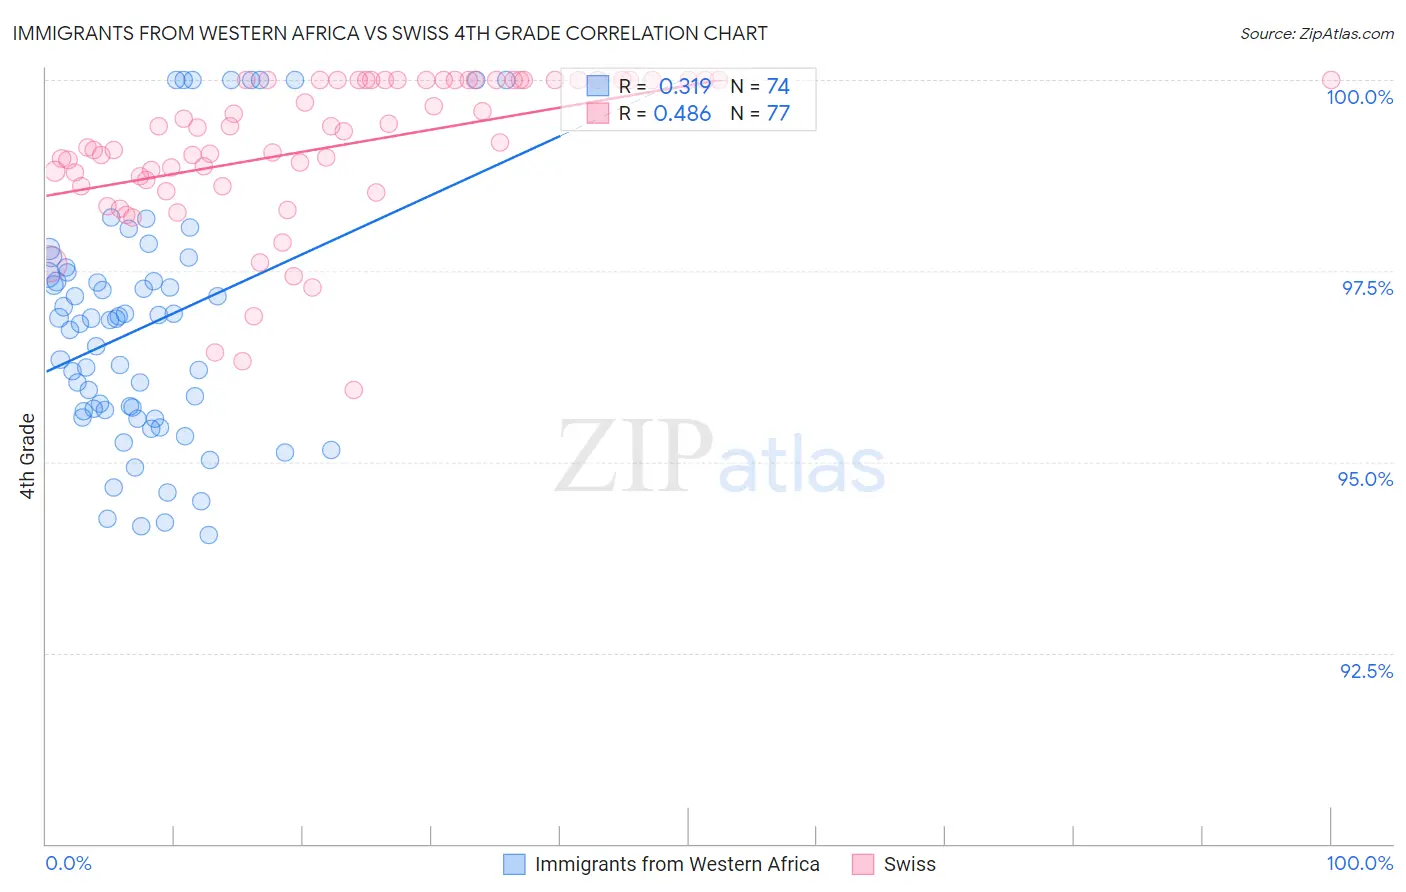
Immigrants from Western Africa vs Swiss 4th Grade Correlation Chart
The statistical analysis conducted on geographies consisting of 357,809,696 people shows a mild positive correlation between the proportion of Immigrants from Western Africa and percentage of population with at least 4th grade education in the United States with a correlation coefficient (R) of 0.319 and weighted average of 96.9%. Similarly, the statistical analysis conducted on geographies consisting of 465,023,158 people shows a moderate positive correlation between the proportion of Swiss and percentage of population with at least 4th grade education in the United States with a correlation coefficient (R) of 0.486 and weighted average of 98.2%, a difference of 1.4%.
4th Grade Correlation Summary
| Measurement | Immigrants from Western Africa | Swiss |
| Minimum | 94.0% | 95.9% |
| Maximum | 100.0% | 100.0% |
| Range | 6.0% | 4.1% |
| Mean | 96.8% | 99.1% |
| Median | 96.9% | 99.3% |
| Interquartile 25% (IQ1) | 95.7% | 98.6% |
| Interquartile 75% (IQ3) | 97.5% | 100.0% |
| Interquartile Range (IQR) | 1.8% | 1.4% |
| Standard Deviation (Sample) | 1.6% | 0.97% |
| Standard Deviation (Population) | 1.6% | 0.97% |
Similar Demographics by 4th Grade
Demographics Similar to Immigrants from Western Africa by 4th Grade
In terms of 4th grade, the demographic groups most similar to Immigrants from Western Africa are Yaqui (96.9%, a difference of 0.0%), Immigrants from Bolivia (96.9%, a difference of 0.0%), Trinidadian and Tobagonian (96.9%, a difference of 0.010%), Immigrants from Ghana (96.9%, a difference of 0.010%), and Afghan (96.9%, a difference of 0.010%).
| Demographics | Rating | Rank | 4th Grade |
| Cubans | 0.2 /100 | #270 | Tragic 96.9% |
| Immigrants | Peru | 0.1 /100 | #271 | Tragic 96.9% |
| Fijians | 0.1 /100 | #272 | Tragic 96.9% |
| Immigrants | Cameroon | 0.1 /100 | #273 | Tragic 96.9% |
| Trinidadians and Tobagonians | 0.1 /100 | #274 | Tragic 96.9% |
| Immigrants | Ghana | 0.1 /100 | #275 | Tragic 96.9% |
| Yaqui | 0.1 /100 | #276 | Tragic 96.9% |
| Immigrants | Western Africa | 0.1 /100 | #277 | Tragic 96.9% |
| Immigrants | Bolivia | 0.1 /100 | #278 | Tragic 96.9% |
| Afghans | 0.1 /100 | #279 | Tragic 96.9% |
| Barbadians | 0.1 /100 | #280 | Tragic 96.9% |
| Immigrants | Hong Kong | 0.1 /100 | #281 | Tragic 96.9% |
| Immigrants | Trinidad and Tobago | 0.1 /100 | #282 | Tragic 96.8% |
| Immigrants | Philippines | 0.1 /100 | #283 | Tragic 96.8% |
| Immigrants | St. Vincent and the Grenadines | 0.1 /100 | #284 | Tragic 96.8% |
Demographics Similar to Swiss by 4th Grade
In terms of 4th grade, the demographic groups most similar to Swiss are Chinese (98.3%, a difference of 0.010%), Chippewa (98.2%, a difference of 0.010%), Italian (98.2%, a difference of 0.010%), British (98.2%, a difference of 0.020%), and European (98.3%, a difference of 0.040%).
| Demographics | Rating | Rank | 4th Grade |
| Croatians | 100.0 /100 | #26 | Exceptional 98.3% |
| French Canadians | 100.0 /100 | #27 | Exceptional 98.3% |
| French | 100.0 /100 | #28 | Exceptional 98.3% |
| Czechs | 100.0 /100 | #29 | Exceptional 98.3% |
| Scandinavians | 100.0 /100 | #30 | Exceptional 98.3% |
| Europeans | 100.0 /100 | #31 | Exceptional 98.3% |
| Chinese | 100.0 /100 | #32 | Exceptional 98.3% |
| Swiss | 100.0 /100 | #33 | Exceptional 98.2% |
| Chippewa | 100.0 /100 | #34 | Exceptional 98.2% |
| Italians | 100.0 /100 | #35 | Exceptional 98.2% |
| British | 100.0 /100 | #36 | Exceptional 98.2% |
| Latvians | 99.9 /100 | #37 | Exceptional 98.2% |
| Aleuts | 99.9 /100 | #38 | Exceptional 98.2% |
| Belgians | 99.9 /100 | #39 | Exceptional 98.2% |
| Luxembourgers | 99.9 /100 | #40 | Exceptional 98.2% |